|
Download Data (XLS File) |
|
||||||||
|
||||||||
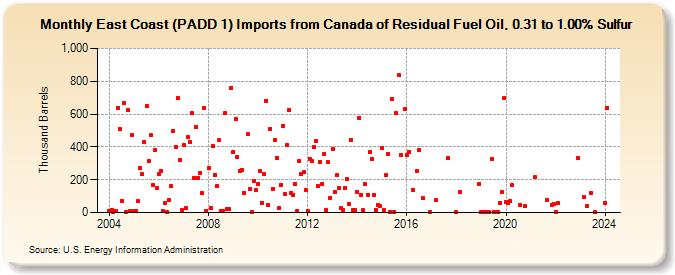
| East Coast (PADD 1) Imports from Canada of Residual Fuel Oil, 0.31 to 1.00% Sulfur (Thousand Barrels) | ||||||||
| Year | Jan | Feb | Mar | Apr | May | Jun | Jul | Aug | Sep | Oct | Nov | Dec |
|---|---|---|---|---|---|---|---|---|---|---|---|---|
| 2004 | 11 | 18 | 6 | 8 | 638 | 511 | 72 | 669 | 4 | 623 | 7 | 471 |
| 2005 | 12 | 8 | 69 | 270 | 234 | 432 | 650 | 315 | 470 | 170 | 379 | 148 |
| 2006 | 236 | 251 | 7 | 59 | 6 | 79 | 161 | 499 | 399 | 697 | 321 | 16 |
| 2007 | 411 | 27 | 459 | 428 | 606 | 213 | 524 | 213 | 241 | 118 | 635 | 12 |
| 2008 | 272 | 27 | 407 | 231 | 160 | 440 | 8 | 7 | 607 | 19 | 19 | 761 |
| 2009 | 369 | 569 | 338 | 254 | 258 | 122 | 480 | 145 | 1 | 191 | 137 | |
| 2010 | 176 | 253 | 59 | 235 | 682 | 46 | 511 | 145 | 444 | 331 | 30 | 168 |
| 2011 | 530 | 111 | 412 | 625 | 120 | 110 | 175 | 11 | 315 | 234 | 246 | 137 |
| 2012 | 9 | 327 | 315 | 400 | 437 | 159 | 309 | 172 | 357 | 15 | 307 | 91 |
| 2013 | 385 | 126 | 228 | 149 | 25 | 18 | 152 | 207 | 55 | 442 | 13 | 14 |
| 2014 | 128 | 578 | 108 | 16 | 172 | 107 | 371 | 328 | 107 | 18 | 48 | 41 |
| 2015 | 391 | 18 | 227 | 356 | 5 | 689 | 5 | 606 | 837 | 351 | 628 | |
| 2016 | 352 | 370 | 136 | 255 | 380 | 87 | 1 | |||||
| 2017 | 76 | 332 | ||||||||||
| 2018 | 2 | 125 | 176 | |||||||||
| 2019 | 2 | 4 | 1 | 2 | 1 | 324 | 1 | 1 | 1 | 61 | 123 | 695 |
| 2020 | 67 | 56 | 70 | 165 | 48 | 40 | ||||||
| 2021 | 216 | 75 | 48 | 50 | ||||||||
| 2022 | 2 | 59 | 331 | |||||||||
| 2023 | 93 | 38 | 121 | 2 | ||||||||
| 2024 | 57 | 638 | 16 | 228 | ||||||||
| - = No Data Reported; -- = Not Applicable; NA = Not Available; W = Withheld to avoid disclosure of individual company data. |
| Release Date: 8/30/2024 |
| Next Release Date: 9/30/2024 |