|
Download Data (XLS File) |
|
||||||||
|
||||||||
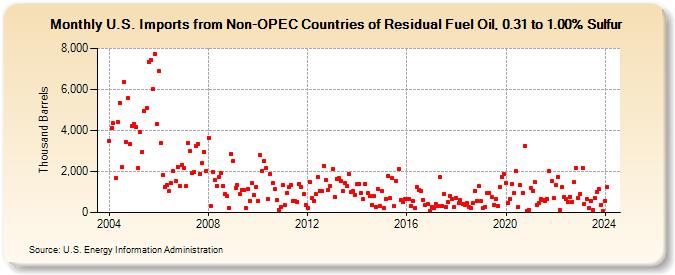
| U.S. Imports from Non-OPEC Countries of Residual Fuel Oil, 0.31 to 1.00% Sulfur (Thousand Barrels) | ||||||||
| Year | Jan | Feb | Mar | Apr | May | Jun | Jul | Aug | Sep | Oct | Nov | Dec |
|---|---|---|---|---|---|---|---|---|---|---|---|---|
| 2004 | 3,491 | 4,103 | 4,343 | 1,683 | 4,411 | 5,358 | 2,211 | 6,376 | 3,439 | 5,571 | 3,324 | 4,198 |
| 2005 | 4,304 | 4,152 | 2,182 | 3,912 | 2,972 | 4,936 | 5,100 | 7,343 | 7,452 | 6,007 | 7,749 | 4,339 |
| 2006 | 6,876 | 3,397 | 1,833 | 1,267 | 1,364 | 1,041 | 1,432 | 2,019 | 1,522 | 2,236 | 1,314 | 2,340 |
| 2007 | 2,174 | 1,276 | 3,406 | 2,993 | 1,927 | 1,959 | 3,249 | 3,345 | 1,869 | 2,397 | 2,960 | 2,038 |
| 2008 | 3,644 | 306 | 1,986 | 1,564 | 1,317 | 1,738 | 1,909 | 1,304 | 897 | 790 | 234 | 2,868 |
| 2009 | 2,533 | 1,200 | 1,339 | 886 | 1,110 | 1,081 | 234 | 1,126 | 559 | 1,439 | 837 | 1,239 |
| 2010 | 585 | 2,787 | 2,002 | 2,528 | 2,168 | 655 | 1,864 | 1,450 | 1,127 | 588 | 149 | 287 |
| 2011 | 1,350 | 347 | 960 | 1,223 | 1,365 | 552 | 560 | 519 | 1,415 | 1,248 | 901 | 382 |
| 2012 | 241 | 1,511 | 719 | 548 | 882 | 1,712 | 1,056 | 1,035 | 2,268 | 1,605 | 1,122 | 1,297 |
| 2013 | 2,111 | 776 | 1,630 | 1,667 | 1,525 | 1,036 | 1,432 | 1,299 | 1,859 | 1,007 | 1,039 | 848 |
| 2014 | 1,409 | 1,394 | 951 | 665 | 1,416 | 942 | 819 | 367 | 785 | 279 | 1,127 | 309 |
| 2015 | 1,027 | 198 | 652 | 1,803 | 693 | 1,678 | 317 | 1,535 | 2,122 | 632 | 491 | 685 |
| 2016 | 683 | 665 | 337 | 573 | 220 | 1,222 | 1,113 | 1,041 | 612 | 345 | 402 | 86 |
| 2017 | 267 | 211 | 438 | 322 | 1,714 | 318 | 916 | 276 | 493 | 819 | 649 | 260 |
| 2018 | 713 | 458 | 593 | 419 | 381 | 469 | 283 | 240 | 454 | 1,066 | 581 | 1,294 |
| 2019 | 539 | 225 | 285 | 937 | 973 | 750 | 388 | 640 | 341 | 1,265 | 1,742 | 1,871 |
| 2020 | 1,463 | 485 | 671 | 1,410 | 951 | 2,025 | 278 | 1,340 | 967 | 3,235 | 77 | 129 |
| 2021 | 1,219 | 1,057 | 1,497 | 371 | 489 | 649 | 631 | 581 | 665 | 2,034 | 1,514 | 708 |
| 2022 | 1,320 | 1,734 | 112 | 1,235 | 736 | 681 | 517 | 772 | 538 | 1,470 | 2,190 | 731 |
| 2023 | 913 | 2,189 | 441 | 676 | 221 | 576 | 102 | 727 | 993 | 1,158 | 371 | 94 |
| 2024 | 586 | |||||||||||
| - = No Data Reported; -- = Not Applicable; NA = Not Available; W = Withheld to avoid disclosure of individual company data. |
| Release Date: 3/29/2024 |
| Next Release Date: 4/30/2024 |