|
Download Data (XLS File) |
|
||||||||
|
||||||||
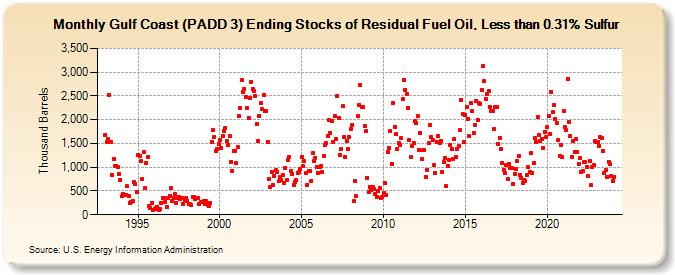
| Gulf Coast (PADD 3) Ending Stocks of Residual Fuel Oil, Less than 0.31% Sulfur (Thousand Barrels) | ||||||||
| Year | Jan | Feb | Mar | Apr | May | Jun | Jul | Aug | Sep | Oct | Nov | Dec |
|---|---|---|---|---|---|---|---|---|---|---|---|---|
| 1993 | 1,684 | 1,523 | 1,597 | 2,521 | 1,539 | 836 | 1,173 | 1,019 | 1,026 | 1,008 | 859 | 727 |
| 1994 | 387 | 444 | 412 | 410 | 594 | 391 | 249 | 271 | 291 | 680 | 640 | 474 |
| 1995 | 1,250 | 1,234 | 1,128 | 759 | 1,315 | 555 | 1,095 | 1,220 | 180 | 140 | 255 | 92 |
| 1996 | 120 | 148 | 164 | 94 | 122 | 256 | 348 | 352 | 268 | 163 | 342 | 392 |
| 1997 | 552 | 295 | 353 | 426 | 257 | 345 | 364 | 339 | 347 | 224 | 303 | 342 |
| 1998 | 292 | 228 | 224 | 197 | 382 | 363 | 323 | 357 | 351 | 223 | 264 | 258 |
| 1999 | 282 | 232 | 286 | 213 | 192 | 249 | 1,540 | 1,774 | 1,640 | 1,349 | 1,388 | 1,491 |
| 2000 | 1,578 | 1,411 | 1,658 | 1,769 | 1,830 | 1,554 | 1,458 | 1,650 | 1,117 | 927 | 1,346 | 1,347 |
| 2001 | 1,079 | 1,429 | 2,087 | 2,243 | 2,829 | 2,587 | 2,643 | 2,483 | 2,248 | 2,035 | 2,451 | 2,798 |
| 2002 | 2,652 | 2,593 | 2,496 | 1,902 | 1,561 | 2,083 | 2,341 | 2,218 | 2,526 | 2,183 | 2,185 | 1,538 |
| 2003 | 749 | 590 | 908 | 616 | 814 | 933 | 901 | 701 | 789 | 729 | 834 | 677 |
| 2004 | 989 | 729 | 1,148 | 1,209 | 917 | 863 | 622 | 696 | 728 | 884 | 901 | 962 |
| 2005 | 1,209 | 1,019 | 1,120 | 878 | 630 | 927 | 923 | 719 | 1,293 | 1,124 | 1,202 | 995 |
| 2006 | 880 | 1,010 | 1,019 | 892 | 1,234 | 1,470 | 1,503 | 1,658 | 1,998 | 1,727 | 1,972 | 1,527 |
| 2007 | 2,067 | 1,584 | 2,491 | 2,031 | 1,263 | 1,379 | 2,281 | 1,644 | 1,212 | 1,557 | 1,387 | 1,632 |
| 2008 | 1,803 | 1,886 | 282 | 714 | 391 | 2,083 | 2,301 | 2,732 | 2,273 | 2,258 | 1,868 | 1,759 |
| 2009 | 780 | 475 | 575 | 524 | 574 | 540 | 432 | 366 | 503 | 553 | 352 | 366 |
| 2010 | 449 | 661 | 421 | 1,311 | 1,401 | 1,757 | 1,075 | 2,343 | 1,854 | 1,691 | 1,375 | 1,505 |
| 2011 | 1,460 | 1,604 | 2,433 | 2,838 | 2,631 | 2,531 | 2,256 | 1,579 | 1,208 | 1,445 | 1,508 | 1,971 |
| 2012 | 1,934 | 2,081 | 1,361 | 1,721 | 1,170 | 1,358 | 1,364 | 800 | 943 | 1,504 | 1,890 | 1,635 |
| 2013 | 1,574 | 1,042 | 886 | 1,523 | 1,654 | 1,513 | 1,559 | 903 | 1,105 | 1,195 | 594 | 1,033 |
| 2014 | 1,150 | 1,465 | 1,388 | 1,174 | 1,601 | 1,211 | 1,392 | 1,436 | 1,788 | 2,419 | 2,115 | 1,540 |
| 2015 | 2,098 | 2,273 | 2,023 | 1,649 | 2,341 | 2,172 | 1,720 | 1,898 | 2,392 | 2,000 | 2,359 | 2,325 |
| 2016 | 2,629 | 3,120 | 2,808 | 2,440 | 2,545 | 2,612 | 2,271 | 2,174 | 2,177 | 1,800 | 2,269 | 2,271 |
| 2017 | 1,496 | 1,623 | 1,382 | 1,096 | 950 | 888 | 1,043 | 753 | 1,074 | 976 | 978 | 650 |
| 2018 | 860 | 954 | 1,129 | 1,235 | 841 | 773 | 675 | 741 | 705 | 844 | 996 | 900 |
| 2019 | 1,302 | 879 | 1,089 | 1,608 | 1,529 | 2,051 | 1,685 | 1,561 | 1,601 | 1,406 | 1,747 | 1,633 |
| 2020 | 1,838 | 2,086 | 1,708 | 2,590 | 2,159 | 2,301 | 2,021 | 1,940 | 1,573 | 1,233 | 1,469 | 1,211 |
| 2021 | 2,193 | 1,838 | 1,777 | 2,860 | 1,947 | 1,654 | 1,225 | 1,542 | 1,322 | 1,597 | 1,318 | 1,071 |
| 2022 | 1,191 | 891 | 910 | 1,099 | 1,109 | 1,002 | 809 | 1,136 | 616 | 1,003 | 1,037 | 1,541 |
| 2023 | 1,523 | 1,533 | 1,450 | 1,632 | 1,618 | 1,340 | 888 | 934 | 799 | 1,116 | 1,059 | 809 |
| 2024 | 700 | |||||||||||
| - = No Data Reported; -- = Not Applicable; NA = Not Available; W = Withheld to avoid disclosure of individual company data. |
| Release Date: 3/29/2024 |
| Next Release Date: 4/30/2024 |