|
Download Data (XLS File) |
|
||||||||
|
||||||||
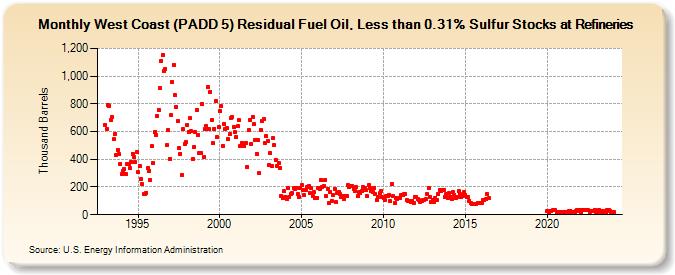
| West Coast (PADD 5) Residual Fuel Oil, Less than 0.31% Sulfur Stocks at Refineries (Thousand Barrels) | ||||||||
| Year | Jan | Feb | Mar | Apr | May | Jun | Jul | Aug | Sep | Oct | Nov | Dec |
|---|---|---|---|---|---|---|---|---|---|---|---|---|
| 1993 | 648 | 622 | 791 | 787 | 682 | 702 | 544 | 579 | 431 | 469 | 435 | 368 |
| 1994 | 293 | 314 | 330 | 292 | 368 | 364 | 335 | 383 | 441 | 416 | 380 | 455 |
| 1995 | 306 | 349 | 256 | 220 | 147 | 148 | 160 | 337 | 319 | 247 | 494 | 372 |
| 1996 | 594 | 578 | 713 | 759 | 911 | 1,110 | 1,154 | 1,036 | 1,051 | 501 | 610 | 403 |
| 1997 | 719 | 959 | 1,082 | 861 | 777 | 676 | 478 | 441 | 287 | 616 | 511 | 522 |
| 1998 | 646 | 597 | 695 | 602 | 401 | 490 | 596 | 759 | 576 | 447 | 445 | 799 |
| 1999 | 415 | 618 | 643 | 920 | 616 | 888 | 684 | 517 | 621 | 817 | 560 | 632 |
| 2000 | 747 | 782 | 499 | 655 | 621 | 624 | 545 | 581 | 696 | 706 | 634 | 595 |
| 2001 | 562 | 637 | 680 | 498 | 519 | 503 | 495 | 521 | 346 | 610 | 684 | 513 |
| 2002 | 708 | 652 | 541 | 441 | 538 | 299 | 613 | 675 | 687 | 520 | 566 | 530 |
| 2003 | 359 | 444 | 351 | 554 | 501 | 396 | 352 | 371 | 339 | 136 | 124 | 168 |
| 2004 | 126 | 111 | 190 | 131 | 148 | 154 | 191 | 186 | 195 | 149 | 130 | 196 |
| 2005 | 213 | 175 | 142 | 180 | 198 | 207 | 158 | 190 | 132 | 161 | 117 | 122 |
| 2006 | 194 | 183 | 248 | 197 | 204 | 248 | 135 | 186 | 82 | 165 | 99 | 139 |
| 2007 | 189 | 91 | 157 | 165 | 147 | 125 | 132 | 111 | 135 | 135 | 211 | 200 |
| 2008 | 205 | 204 | 186 | 174 | 197 | 135 | 165 | 154 | 172 | 199 | 195 | 176 |
| 2009 | 133 | 213 | 196 | 173 | 165 | 196 | 146 | 103 | 129 | 154 | 172 | 126 |
| 2010 | 117 | 105 | 135 | 135 | 141 | 96 | 220 | 133 | 86 | 121 | 114 | 118 |
| 2011 | 122 | 142 | 142 | 149 | 151 | 103 | 102 | 101 | 94 | 100 | 88 | 130 |
| 2012 | 125 | 113 | 103 | 94 | 102 | 107 | 108 | 110 | 146 | 191 | 126 | 94 |
| 2013 | 103 | 93 | 123 | 109 | 147 | 179 | 171 | 178 | 181 | 130 | 148 | 117 |
| 2014 | 158 | 131 | 116 | 162 | 145 | 120 | 130 | 168 | 147 | 131 | 137 | 161 |
| 2015 | 145 | 129 | 129 | 101 | 83 | 77 | 76 | 78 | 80 | 87 | 88 | 88 |
| 2016 | 88 | 104 | 109 | 111 | 146 | 117 | ||||||
| 2020 | 29 | 15 | 29 | 30 | 31 | 32 | 32 | 17 | 18 | 23 | 19 | 23 |
| 2021 | 16 | 16 | 19 | 18 | 30 | 30 | 17 | 23 | 20 | 26 | 36 | 29 |
| 2022 | 37 | 19 | 36 | 32 | 36 | 35 | 34 | 21 | 25 | 27 | 25 | 36 |
| 2023 | 20 | 21 | 36 | 28 | 22 | 24 | 18 | 18 | 31 | 33 | 29 | 20 |
| 2024 | 21 | |||||||||||
| - = No Data Reported; -- = Not Applicable; NA = Not Available; W = Withheld to avoid disclosure of individual company data. |
| Release Date: 3/29/2024 |
| Next Release Date: 4/30/2024 |