|
Download Data (XLS File) |
|
||||||||
|
||||||||
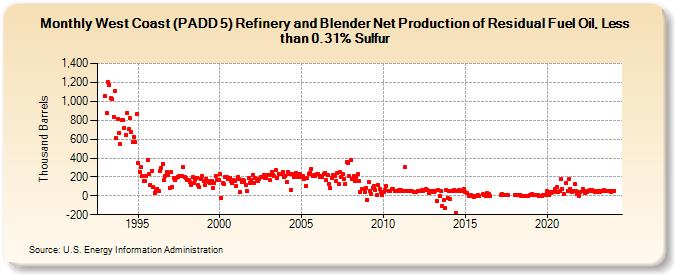
| West Coast (PADD 5) Refinery and Blender Net Production of Residual Fuel Oil, Less than 0.31% Sulfur (Thousand Barrels) | ||||||||
| Year | Jan | Feb | Mar | Apr | May | Jun | Jul | Aug | Sep | Oct | Nov | Dec |
|---|---|---|---|---|---|---|---|---|---|---|---|---|
| 1993 | 1,052 | 874 | 1,207 | 1,175 | 1,030 | 1,021 | 839 | 1,112 | 611 | 809 | 664 | 545 |
| 1994 | 798 | 797 | 718 | 645 | 881 | 702 | 818 | 671 | 569 | 624 | 569 | 862 |
| 1995 | 351 | 256 | 301 | 205 | 160 | 155 | 213 | 383 | 236 | 117 | 266 | 91 |
| 1996 | 35 | 47 | 76 | 46 | 267 | 296 | 340 | 167 | 212 | 253 | 218 | 83 |
| 1997 | 249 | 97 | 190 | 171 | 193 | 202 | 205 | 214 | 205 | 304 | 200 | 191 |
| 1998 | 171 | 163 | 143 | 118 | 197 | 133 | 170 | 192 | 110 | 90 | 183 | 208 |
| 1999 | 152 | 110 | 181 | 154 | 149 | 131 | 158 | 85 | 137 | 212 | 168 | 169 |
| 2000 | 236 | -19 | 135 | 120 | 196 | 194 | 182 | 193 | 156 | 138 | 171 | 159 |
| 2001 | 101 | 196 | 176 | 41 | 147 | 166 | 160 | 119 | 52 | 190 | 134 | 165 |
| 2002 | 215 | 131 | 189 | 172 | 160 | 173 | 199 | 201 | 216 | 186 | 185 | 222 |
| 2003 | 224 | 165 | 249 | 218 | 205 | 272 | 190 | 235 | 226 | 229 | 255 | 199 |
| 2004 | 210 | 142 | 250 | 231 | 59 | 228 | 199 | 231 | 246 | 199 | 221 | 235 |
| 2005 | 204 | 208 | 180 | 103 | 185 | 235 | 244 | 288 | 212 | 216 | 213 | 227 |
| 2006 | 229 | 199 | 205 | 201 | 229 | 239 | 164 | 218 | 126 | 82 | 193 | 217 |
| 2007 | 211 | 152 | 237 | 124 | 250 | 202 | 227 | 174 | 127 | 360 | 346 | 206 |
| 2008 | 376 | 180 | 213 | 156 | 197 | 228 | 152 | 38 | 68 | 72 | 41 | 81 |
| 2009 | -43 | 151 | 50 | 17 | 87 | 106 | 59 | 8 | 113 | 74 | 43 | 10 |
| 2010 | 41 | 61 | 105 | 56 | 53 | 70 | 74 | 50 | 55 | 54 | 58 | |
| 2011 | 51 | 60 | 48 | 56 | 300 | 52 | 49 | 49 | 51 | 46 | 43 | 42 |
| 2012 | 45 | 46 | 50 | 49 | 58 | 56 | 66 | 71 | 66 | 28 | 52 | 36 |
| 2013 | 49 | 40 | 50 | -53 | 58 | -5 | 53 | -110 | -48 | -128 | 64 | -19 |
| 2014 | 47 | -39 | 53 | 46 | 63 | -177 | 47 | 58 | 51 | 54 | 60 | 68 |
| 2015 | 44 | 30 | -1 | 5 | -6 | -9 | 2 | 2 | 7 | 1 | ||
| 2016 | 16 | 5 | 2 | 35 | 21 | 1 | ||||||
| 2017 | 10 | 14 | 9 | 4 | 7 | |||||||
| 2018 | 11 | 13 | 5 | 11 | 11 | 2 | 1 | 2 | 2 | 2 | 2 | 4 |
| 2019 | 4 | 14 | 5 | 4 | 10 | 4 | 3 | 2 | 2 | 9 | 6 | 7 |
| 2020 | 47 | 5 | 38 | 33 | 37 | 38 | 76 | 94 | 43 | 46 | 174 | 67 |
| 2021 | 23 | 134 | 54 | 179 | 76 | 44 | 46 | 121 | 54 | 24 | 2 | |
| 2022 | 42 | 74 | 46 | 30 | 41 | 54 | 59 | 55 | 58 | 48 | 39 | |
| 2023 | 40 | 55 | 53 | 41 | 52 | 47 | 58 | 47 | 53 | 51 | 53 | 42 |
| 2024 | 53 | |||||||||||
| - = No Data Reported; -- = Not Applicable; NA = Not Available; W = Withheld to avoid disclosure of individual company data. |
| Release Date: 3/29/2024 |
| Next Release Date: 4/30/2024 |