|
Download Data (XLS File) |
|
||||||||
|
||||||||
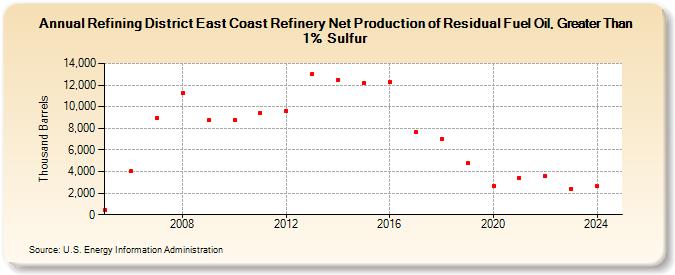
| Refining District East Coast Refinery Net Production of Residual Fuel Oil, Greater Than 1% Sulfur (Thousand Barrels) | ||||||||
| Decade | Year-0 | Year-1 | Year-2 | Year-3 | Year-4 | Year-5 | Year-6 | Year-7 | Year-8 | Year-9 |
|---|---|---|---|---|---|---|---|---|---|---|
| 2000's | 416 | 4,069 | 8,949 | 11,289 | 8,723 | |||||
| 2010's | 8,810 | 9,452 | 9,614 | 13,037 | 12,515 | 12,197 | 12,331 | 7,678 | 7,052 | 4,786 |
| 2020's | 2,663 | 3,424 | 3,606 | 2,413 |
| - = No Data Reported; -- = Not Applicable; NA = Not Available; W = Withheld to avoid disclosure of individual company data. |
| Release Date: 3/29/2024 |
| Next Release Date: 8/30/2024 |