|
Download Data (XLS File) |
|
||||||||
|
||||||||
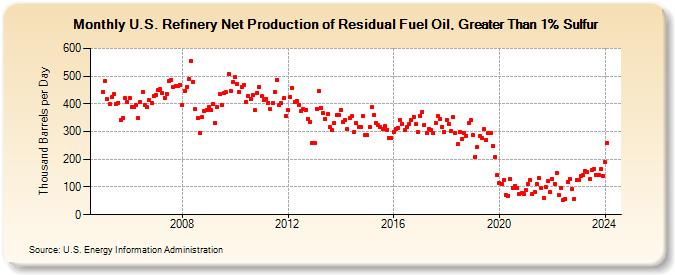
| U.S. Refinery Net Production of Residual Fuel Oil, Greater Than 1% Sulfur (Thousand Barrels per Day) | ||||||||
| Year | Jan | Feb | Mar | Apr | May | Jun | Jul | Aug | Sep | Oct | Nov | Dec |
|---|---|---|---|---|---|---|---|---|---|---|---|---|
| 2005 | 443 | 482 | 417 | 399 | 425 | 434 | 401 | 404 | 341 | 350 | 421 | 406 |
| 2006 | 420 | 390 | 390 | 395 | 348 | 407 | 443 | 395 | 388 | 413 | 402 | 428 |
| 2007 | 433 | 450 | 452 | 439 | 422 | 437 | 483 | 487 | 460 | 466 | 465 | 469 |
| 2008 | 395 | 448 | 459 | 488 | 553 | 480 | 380 | 348 | 293 | 351 | 374 | 377 |
| 2009 | 390 | 376 | 400 | 330 | 389 | 436 | 396 | 440 | 442 | 509 | 447 | 477 |
| 2010 | 495 | 473 | 442 | 459 | 468 | 406 | 430 | 418 | 433 | 376 | 440 | 461 |
| 2011 | 427 | 414 | 418 | 404 | 380 | 402 | 444 | 487 | 394 | 402 | 420 | 356 |
| 2012 | 376 | 425 | 458 | 407 | 410 | 397 | 375 | 382 | 377 | 347 | 336 | 258 |
| 2013 | 258 | 382 | 445 | 386 | 366 | 347 | 362 | 315 | 304 | 330 | 360 | 359 |
| 2014 | 378 | 333 | 342 | 308 | 348 | 355 | 299 | 332 | 318 | 317 | 356 | 286 |
| 2015 | 286 | 316 | 387 | 360 | 332 | 322 | 318 | 310 | 319 | 307 | 278 | 277 |
| 2016 | 298 | 310 | 313 | 342 | 328 | 305 | 318 | 327 | 340 | 354 | 326 | 297 |
| 2017 | 357 | 372 | 324 | 295 | 310 | 307 | 296 | 331 | 355 | 347 | 318 | 300 |
| 2018 | 342 | 327 | 302 | 352 | 294 | 254 | 299 | 274 | 293 | 285 | 330 | 340 |
| 2019 | 288 | 210 | 244 | 285 | 278 | 308 | 271 | 296 | 293 | 248 | 209 | 142 |
| 2020 | 113 | 110 | 125 | 71 | 69 | 129 | 98 | 103 | 97 | 74 | 77 | 74 |
| 2021 | 90 | 110 | 125 | 75 | 83 | 110 | 133 | 95 | 61 | 101 | 120 | 83 |
| 2022 | 130 | 112 | 151 | 72 | 98 | 53 | 58 | 117 | 128 | 93 | 56 | 125 |
| 2023 | 127 | 138 | 142 | 158 | 154 | 129 | 161 | 166 | 145 | 143 | 164 | 140 |
| 2024 | 189 | |||||||||||
| - = No Data Reported; -- = Not Applicable; NA = Not Available; W = Withheld to avoid disclosure of individual company data. |
| Release Date: 3/29/2024 |
| Next Release Date: 4/30/2024 |