|
Download Data (XLS File) |
|
||||||||
|
||||||||
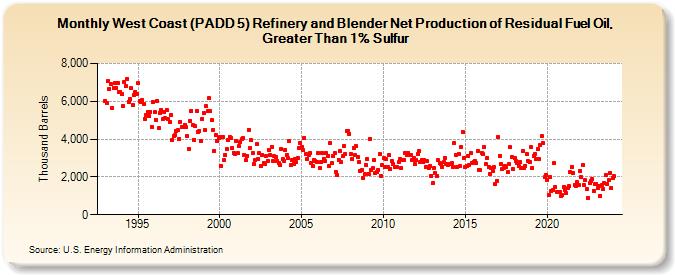
| West Coast (PADD 5) Refinery and Blender Net Production of Residual Fuel Oil, Greater Than 1% Sulfur (Thousand Barrels) | ||||||||
| Year | Jan | Feb | Mar | Apr | May | Jun | Jul | Aug | Sep | Oct | Nov | Dec |
|---|---|---|---|---|---|---|---|---|---|---|---|---|
| 1993 | 6,022 | 5,929 | 7,079 | 6,641 | 6,902 | 5,665 | 6,705 | 6,951 | 6,681 | 6,951 | 6,503 | 6,479 |
| 1994 | 6,362 | 5,746 | 7,044 | 6,787 | 7,203 | 5,983 | 6,141 | 6,695 | 5,790 | 6,338 | 6,502 | 6,393 |
| 1995 | 6,948 | 6,020 | 5,957 | 6,079 | 5,881 | 5,084 | 5,287 | 5,428 | 5,224 | 5,459 | 4,657 | 5,970 |
| 1996 | 5,423 | 5,025 | 6,031 | 4,586 | 5,402 | 5,558 | 5,058 | 5,412 | 5,096 | 5,524 | 5,038 | 4,899 |
| 1997 | 5,281 | 3,956 | 4,138 | 4,210 | 4,439 | 4,456 | 4,029 | 4,911 | 4,649 | 4,657 | 4,772 | 4,628 |
| 1998 | 4,153 | 3,485 | 4,968 | 5,504 | 4,725 | 3,978 | 4,667 | 5,494 | 4,393 | 4,441 | 3,887 | 5,089 |
| 1999 | 5,406 | 4,491 | 5,729 | 5,460 | 6,157 | 5,460 | 4,996 | 4,506 | 3,370 | 4,240 | 3,919 | 4,079 |
| 2000 | 4,098 | 2,552 | 4,130 | 2,893 | 3,158 | 3,455 | 3,978 | 4,107 | 4,076 | 3,517 | 3,278 | 3,216 |
| 2001 | 3,873 | 3,254 | 3,610 | 3,850 | 3,979 | 4,049 | 3,171 | 2,868 | 3,106 | 4,498 | 3,523 | 3,934 |
| 2002 | 3,271 | 2,665 | 2,885 | 3,727 | 2,964 | 3,244 | 2,587 | 3,159 | 2,756 | 2,689 | 3,104 | 2,836 |
| 2003 | 3,432 | 3,164 | 3,607 | 2,843 | 3,086 | 3,046 | 2,862 | 2,722 | 2,620 | 3,477 | 2,932 | 2,864 |
| 2004 | 3,443 | 3,179 | 2,974 | 3,876 | 2,615 | 2,884 | 2,689 | 2,949 | 2,776 | 3,013 | 3,544 | 3,778 |
| 2005 | 3,597 | 3,402 | 4,068 | 3,204 | 2,964 | 3,140 | 3,269 | 2,728 | 2,565 | 2,906 | 2,846 | 2,803 |
| 2006 | 3,261 | 2,454 | 2,769 | 3,282 | 2,971 | 2,859 | 3,242 | 3,090 | 2,553 | 3,787 | 2,710 | 3,084 |
| 2007 | 3,252 | 2,274 | 2,083 | 2,907 | 3,369 | 2,779 | 3,087 | 3,635 | 3,219 | 4,439 | 4,439 | 4,284 |
| 2008 | 3,221 | 2,957 | 3,544 | 3,138 | 3,613 | 3,078 | 2,789 | 2,310 | 2,346 | 1,949 | 2,140 | 2,630 |
| 2009 | 2,922 | 2,164 | 4,029 | 2,370 | 2,469 | 2,896 | 2,227 | 2,248 | 2,389 | 3,208 | 2,056 | 2,625 |
| 2010 | 2,995 | 2,526 | 2,942 | 2,531 | 3,151 | 2,420 | 2,841 | 2,664 | 2,538 | 2,506 | 2,521 | 2,772 |
| 2011 | 2,921 | 2,494 | 2,881 | 2,888 | 3,262 | 3,159 | 3,291 | 3,150 | 3,150 | 2,899 | 2,977 | 2,677 |
| 2012 | 2,893 | 3,223 | 3,349 | 2,806 | 2,901 | 2,784 | 2,875 | 2,547 | 2,820 | 2,454 | 2,567 | 2,069 |
| 2013 | 1,660 | 2,465 | 2,199 | 2,055 | 2,880 | 2,723 | 2,702 | 2,543 | 2,777 | 2,989 | 2,680 | 2,641 |
| 2014 | 2,662 | 2,659 | 2,717 | 2,542 | 3,808 | 3,171 | 2,536 | 3,187 | 2,572 | 3,591 | 4,374 | 3,022 |
| 2015 | 2,528 | 2,562 | 3,103 | 2,643 | 3,257 | 2,723 | 2,791 | 2,859 | 2,748 | 3,381 | 2,377 | 2,351 |
| 2016 | 3,286 | 3,199 | 3,563 | 2,686 | 3,020 | 2,499 | 2,174 | 2,497 | 2,334 | 2,499 | 1,616 | 1,806 |
| 2017 | 4,109 | 3,129 | 2,689 | 2,400 | 2,474 | 2,597 | 2,546 | 2,253 | 2,689 | 3,581 | 3,048 | 2,407 |
| 2018 | 2,974 | 2,857 | 2,761 | 2,574 | 2,782 | 2,463 | 3,367 | 2,489 | 2,603 | 3,211 | 2,823 | 2,788 |
| 2019 | 3,563 | 2,473 | 3,118 | 3,223 | 2,959 | 3,451 | 2,939 | 3,712 | 4,153 | 3,772 | 1,986 | 2,108 |
| 2020 | 1,852 | 1,022 | 1,984 | 1,248 | 1,301 | 2,734 | 1,442 | 1,190 | 1,219 | 1,185 | 964 | 1,042 |
| 2021 | 1,487 | 1,320 | 1,139 | 1,389 | 1,504 | 2,241 | 2,534 | 2,186 | 1,591 | 1,545 | 1,712 | 1,561 |
| 2022 | 2,320 | 1,992 | 2,621 | 1,587 | 1,819 | 1,334 | 875 | 1,688 | 1,790 | 1,874 | 1,276 | 1,616 |
| 2023 | 1,631 | 1,405 | 1,496 | 1,012 | 1,571 | 1,383 | 1,665 | 2,107 | 1,629 | 1,819 | 2,220 | 1,423 |
| 2024 | 1,961 | |||||||||||
| - = No Data Reported; -- = Not Applicable; NA = Not Available; W = Withheld to avoid disclosure of individual company data. |
| Release Date: 3/29/2024 |
| Next Release Date: 4/30/2024 |