|
Download Data (XLS File) |
|
||||||||
|
||||||||
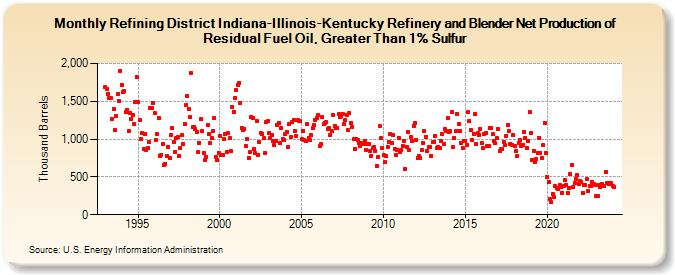
| Refining District Indiana-Illinois-Kentucky Refinery and Blender Net Production of Residual Fuel Oil, Greater Than 1% Sulfur (Thousand Barrels) | ||||||||
| Year | Jan | Feb | Mar | Apr | May | Jun | Jul | Aug | Sep | Oct | Nov | Dec |
|---|---|---|---|---|---|---|---|---|---|---|---|---|
| 1993 | 1,690 | 1,667 | 1,597 | 1,548 | 1,542 | 1,264 | 1,396 | 1,118 | 1,304 | 1,601 | 1,504 | 1,901 |
| 1994 | 1,717 | 1,618 | 1,631 | 1,358 | 1,389 | 1,103 | 1,349 | 1,271 | 1,321 | 1,203 | 1,488 | 1,823 |
| 1995 | 1,490 | 1,246 | 1,006 | 1,079 | 869 | 1,065 | 862 | 881 | 957 | 1,410 | 1,410 | 1,476 |
| 1996 | 1,339 | 984 | 1,068 | 1,279 | 780 | 787 | 937 | 652 | 677 | 771 | 900 | 752 |
| 1997 | 1,054 | 1,143 | 968 | 833 | 1,018 | 1,025 | 782 | 884 | 1,052 | 936 | 1,198 | 1,446 |
| 1998 | 1,569 | 1,397 | 1,288 | 1,870 | 1,154 | 1,163 | 1,136 | 1,094 | 826 | 950 | 1,262 | 1,104 |
| 1999 | 813 | 722 | 767 | 1,185 | 1,071 | 947 | 1,016 | 1,101 | 1,273 | 761 | 726 | 821 |
| 2000 | 1,046 | 784 | 786 | 1,002 | 1,064 | 828 | 1,077 | 1,009 | 837 | 1,429 | 1,363 | 1,546 |
| 2001 | 1,648 | 1,714 | 1,743 | 1,473 | 1,147 | 1,122 | 1,135 | 908 | 1,004 | 754 | 827 | 1,298 |
| 2002 | 1,283 | 863 | 811 | 1,242 | 790 | 963 | 1,087 | 1,073 | 1,008 | 815 | 1,225 | 1,241 |
| 2003 | 1,076 | 1,014 | 1,057 | 969 | 916 | 975 | 1,180 | 1,215 | 950 | 1,148 | 999 | 982 |
| 2004 | 1,063 | 1,098 | 897 | 1,206 | 1,025 | 1,226 | 1,251 | 1,102 | 1,037 | 1,246 | 1,241 | 1,234 |
| 2005 | 995 | 1,111 | 984 | 980 | 1,200 | 1,015 | 985 | 1,057 | 1,143 | 1,185 | 1,251 | 1,281 |
| 2006 | 1,322 | 907 | 932 | 1,289 | 1,202 | 1,215 | 1,221 | 1,136 | 1,144 | 1,057 | 1,109 | 1,320 |
| 2007 | 1,174 | 1,148 | 1,144 | 1,328 | 1,287 | 1,309 | 1,336 | 1,195 | 1,249 | 1,318 | 1,119 | 1,342 |
| 2008 | 1,214 | 1,159 | 996 | 874 | 1,003 | 994 | 954 | 908 | 955 | 929 | 972 | 853 |
| 2009 | 935 | 930 | 843 | 781 | 883 | 897 | 844 | 650 | 768 | 1,167 | 1,009 | 882 |
| 2010 | 788 | 693 | 771 | 894 | 959 | 1,062 | 946 | 1,052 | 874 | 790 | 859 | 1,015 |
| 2011 | 829 | 853 | 910 | 981 | 606 | 901 | 1,096 | 855 | 1,024 | 980 | 1,176 | 1,211 |
| 2012 | 994 | 752 | 776 | 748 | 861 | 953 | 1,103 | 1,033 | 837 | 893 | 897 | 774 |
| 2013 | 967 | 967 | 1,046 | 878 | 902 | 888 | 973 | 1,070 | 935 | 1,129 | 1,105 | 1,276 |
| 2014 | 1,097 | 1,105 | 1,353 | 897 | 1,018 | 1,103 | 1,332 | 1,200 | 1,107 | 952 | 886 | 970 |
| 2015 | 978 | 924 | 1,354 | 1,239 | 1,118 | 992 | 1,071 | 1,337 | 933 | 1,075 | 1,055 | 1,140 |
| 2016 | 952 | 888 | 1,072 | 1,084 | 913 | 915 | 1,151 | 1,143 | 1,063 | 970 | 951 | 1,015 |
| 2017 | 1,137 | 843 | 863 | 866 | 960 | 917 | 1,046 | 1,191 | 1,105 | 941 | 925 | 1,052 |
| 2018 | 912 | 841 | 778 | 955 | 984 | 904 | 928 | 1,096 | 1,019 | 883 | 979 | 1,359 |
| 2019 | 1,087 | 722 | 848 | 692 | 735 | 817 | 1,019 | 819 | 755 | 922 | 1,216 | 822 |
| 2020 | 503 | 435 | 213 | 164 | 273 | 230 | 379 | 358 | 343 | 397 | 368 | 292 |
| 2021 | 380 | 454 | 396 | 293 | 359 | 539 | 664 | 371 | 424 | 478 | 525 | 407 |
| 2022 | 444 | 438 | 289 | 393 | 395 | 473 | 320 | 386 | 379 | 432 | 409 | 390 |
| 2023 | 251 | 243 | 393 | 362 | 410 | 384 | 378 | 564 | 414 | 410 | 425 | 415 |
| 2024 | 374 | |||||||||||
| - = No Data Reported; -- = Not Applicable; NA = Not Available; W = Withheld to avoid disclosure of individual company data. |
| Release Date: 3/29/2024 |
| Next Release Date: 4/30/2024 |