|
Download Data (XLS File) |
|
||||||||
|
||||||||
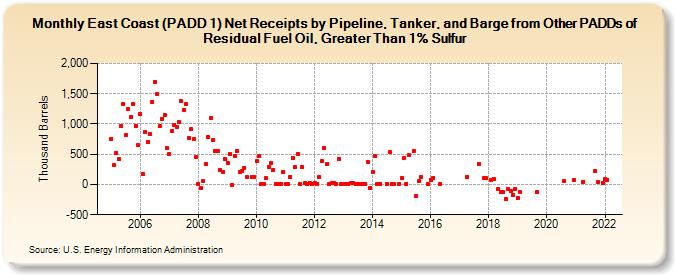
| East Coast (PADD 1) Net Receipts by Pipeline, Tanker, and Barge from Other PADDs of Residual Fuel Oil, Greater Than 1% Sulfur (Thousand Barrels) | ||||||||
| Year | Jan | Feb | Mar | Apr | May | Jun | Jul | Aug | Sep | Oct | Nov | Dec |
|---|---|---|---|---|---|---|---|---|---|---|---|---|
| 2005 | 752 | 314 | 518 | 416 | 971 | 1,322 | 817 | 1,254 | 1,120 | 1,333 | 965 | 647 |
| 2006 | 1,170 | 165 | 868 | 700 | 829 | 1,368 | 1,698 | 1,501 | 959 | 1,088 | 1,145 | 597 |
| 2007 | 504 | 881 | 991 | 950 | 1,031 | 1,378 | 1,236 | 1,329 | 765 | 916 | 754 | 447 |
| 2008 | 6 | -52 | 52 | 335 | 777 | 1,091 | 733 | 553 | 551 | 240 | 210 | 422 |
| 2009 | 358 | 499 | -6 | 463 | 551 | 203 | 224 | 278 | 123 | 122 | 120 | |
| 2010 | 388 | 473 | 6 | 7 | 101 | 296 | 349 | 244 | 7 | 14 | 14 | 208 |
| 2011 | 12 | 6 | 130 | 445 | 282 | 507 | 15 | 287 | 21 | 15 | 22 | 15 |
| 2012 | 22 | 16 | 124 | 384 | 599 | 337 | 6 | 19 | 31 | 14 | 425 | 7 |
| 2013 | 15 | 15 | 14 | 17 | 17 | 14 | 15 | 14 | 7 | 7 | 374 | -51 |
| 2014 | 205 | 464 | 8 | 9 | 15 | 533 | 7 | 7 | 14 | |||
| 2015 | 105 | 436 | 13 | 483 | 546 | -188 | 59 | 118 | 7 | |||
| 2016 | 76 | 115 | 8 | |||||||||
| 2017 | 129 | 340 | 100 | 99 | ||||||||
| 2018 | 70 | 94 | -73 | -119 | -132 | -241 | -75 | -116 | -166 | -71 | ||
| 2019 | -218 | -129 | -121 | |||||||||
| 2020 | 53 | 70 | ||||||||||
| 2021 | 49 | 228 | 45 | 27 | ||||||||
| 2022 | 92 | 80 | ||||||||||
| - = No Data Reported; -- = Not Applicable; NA = Not Available; W = Withheld to avoid disclosure of individual company data. |
| Release Date: 3/29/2024 |
| Next Release Date: 4/30/2024 |