|
Download Data (XLS File) |
|
||||||||
|
||||||||
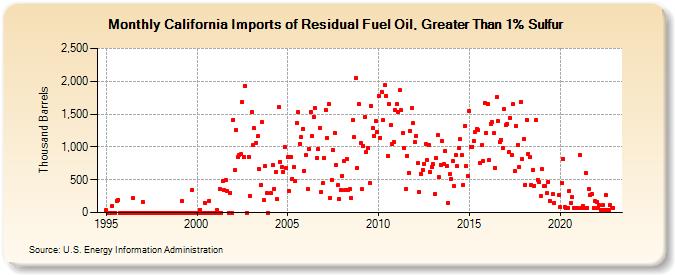
| California Imports of Residual Fuel Oil, Greater Than 1% Sulfur (Thousand Barrels) | ||||||||
| Year | Jan | Feb | Mar | Apr | May | Jun | Jul | Aug | Sep | Oct | Nov | Dec |
|---|---|---|---|---|---|---|---|---|---|---|---|---|
| 1995 | 35 | 0 | 0 | 0 | 100 | 0 | 0 | 180 | 198 | 0 | 0 | 0 |
| 1996 | 0 | 0 | 0 | 0 | 0 | 0 | 217 | 0 | 0 | 0 | 0 | 0 |
| 1997 | 165 | 0 | 0 | 0 | 0 | 0 | 0 | 0 | 0 | 0 | 0 | 0 |
| 1998 | 0 | 0 | 0 | 0 | 0 | 0 | 0 | 0 | 0 | 0 | 0 | 0 |
| 1999 | 0 | 0 | 172 | 0 | 0 | 0 | 0 | 0 | 0 | 350 | 0 | 0 |
| 2000 | 0 | 0 | 41 | 0 | 0 | 151 | 0 | 0 | 177 | 0 | 0 | 0 |
| 2001 | 0 | 42 | 0 | 365 | 0 | 483 | 342 | 501 | 329 | 0 | 300 | 0 |
| 2002 | 1,416 | 644 | 1,257 | 845 | 875 | 887 | 1,680 | 839 | 1,926 | 0 | 853 | 256 |
| 2003 | 1,535 | 1,025 | 1,281 | 1,066 | 1,162 | 664 | 418 | 1,379 | 186 | 704 | 299 | 0 |
| 2004 | 296 | 724 | 365 | 611 | 205 | 1,605 | 776 | 693 | 624 | 1,005 | 678 | |
| 2005 | 840 | 328 | 844 | 515 | 695 | 484 | 1,370 | 1,529 | 1,050 | 1,146 | 1,277 | 636 |
| 2006 | 874 | 354 | 971 | 1,536 | 1,160 | 1,459 | 1,586 | 830 | 962 | 1,295 | 314 | 444 |
| 2007 | 836 | 1,562 | 1,137 | 1,650 | 227 | 499 | 949 | 1,218 | 718 | 414 | 208 | 347 |
| 2008 | 561 | 778 | 350 | 817 | 350 | 355 | 225 | 1,407 | 1,146 | 2,051 | 686 | 1,648 |
| 2009 | 1,063 | 353 | 1,016 | 1,454 | 925 | 979 | 454 | 1,629 | 1,282 | 1,173 | 1,398 | 1,234 |
| 2010 | 1,777 | 1,136 | 1,836 | 1,407 | 1,935 | 1,780 | 854 | 1,648 | 1,328 | 1,038 | 1,075 | 1,564 |
| 2011 | 1,646 | 1,525 | 1,860 | 1,556 | 1,212 | 990 | 360 | 867 | 607 | 1,243 | 1,588 | 1,358 |
| 2012 | 1,070 | 1,168 | 749 | 316 | 588 | 647 | 744 | 1,043 | 796 | 1,031 | 617 | 693 |
| 2013 | 739 | 279 | 831 | 1,174 | 534 | 731 | 1,091 | 739 | 934 | 709 | 150 | 580 |
| 2014 | 515 | 781 | 404 | 872 | 705 | 978 | 1,116 | 873 | 424 | 1,315 | 710 | 560 |
| 2015 | 1,544 | 994 | 1,004 | 1,087 | 1,229 | 1,275 | 1,254 | 748 | 1,026 | 788 | 1,674 | 1,215 |
| 2016 | 1,653 | 798 | 1,353 | 1,378 | 1,206 | 685 | 1,763 | 1,393 | 1,079 | 1,111 | 987 | 1,573 |
| 2017 | 1,331 | 1,351 | 918 | 1,445 | 880 | 1,653 | 630 | 1,321 | 1,036 | 694 | 1,688 | 818 |
| 2018 | 1,122 | 422 | 1,417 | 891 | 839 | 423 | 651 | 409 | 1,414 | 500 | 465 | 248 |
| 2019 | 656 | 404 | 399 | 293 | 464 | 177 | 277 | 151 | 261 | |||
| 2020 | 79 | 456 | 812 | 88 | 75 | 75 | 334 | 150 | 238 | 75 | 73 | 75 |
| 2021 | 880 | 76 | 99 | 76 | 601 | 77 | 359 | 268 | 279 | 73 | 172 | |
| 2022 | 164 | 73 | 110 | 36 | 111 | 37 | 265 | 37 | 37 | 111 | 76 | 74 |
| - = No Data Reported; -- = Not Applicable; NA = Not Available; W = Withheld to avoid disclosure of individual company data. |
| Release Date: 3/29/2024 |
| Next Release Date: 4/30/2024 |