|
Download Data (XLS File) |
|
||||||||
|
||||||||
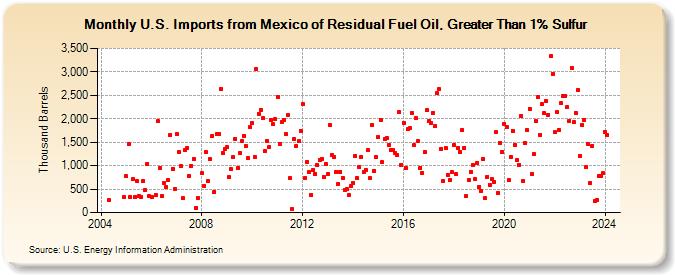
| U.S. Imports from Mexico of Residual Fuel Oil, Greater Than 1% Sulfur (Thousand Barrels) | ||||||||
| Year | Jan | Feb | Mar | Apr | May | Jun | Jul | Aug | Sep | Oct | Nov | Dec |
|---|---|---|---|---|---|---|---|---|---|---|---|---|
| 2004 | 259 | 330 | ||||||||||
| 2005 | 771 | 1,455 | 332 | 708 | 326 | 674 | 351 | 327 | 670 | 480 | 1,043 | 346 |
| 2006 | 323 | 379 | 1,943 | 951 | 352 | 629 | 548 | 688 | 1,656 | 931 | 493 | |
| 2007 | 1,669 | 1,300 | 995 | 302 | 1,329 | 1,379 | 790 | 1,002 | 1,140 | 106 | 311 | |
| 2008 | 837 | 570 | 1,281 | 673 | 1,134 | 1,641 | 446 | 1,669 | 1,670 | 2,641 | 1,272 | 1,356 |
| 2009 | 1,392 | 761 | 921 | 1,185 | 1,571 | 944 | 1,272 | 1,517 | 1,640 | 1,411 | 1,170 | 1,817 |
| 2010 | 1,906 | 1,191 | 3,057 | 2,110 | 2,186 | 2,020 | 1,309 | 1,521 | 1,398 | 1,970 | 1,881 | 1,987 |
| 2011 | 2,471 | 1,466 | 1,932 | 1,970 | 1,673 | 2,070 | 730 | 78 | 1,567 | 1,418 | 1,515 | 1,748 |
| 2012 | 2,308 | 736 | 1,078 | 868 | 383 | 902 | 822 | 1,006 | 1,117 | 1,148 | 762 | 1,039 |
| 2013 | 823 | 1,866 | 1,225 | 1,182 | 875 | 616 | 871 | 747 | 486 | 507 | 372 | 575 |
| 2014 | 639 | 1,208 | 733 | 974 | 1,183 | 861 | 914 | 1,325 | 729 | 1,867 | 893 | 1,185 |
| 2015 | 1,606 | 1,980 | 1,070 | 1,561 | 1,592 | 1,433 | 1,332 | 1,325 | 1,275 | 1,226 | 2,139 | 1,020 |
| 2016 | 1,919 | 955 | 1,773 | 1,802 | 2,124 | 1,430 | 2,015 | 1,516 | 956 | 846 | 1,294 | 2,178 |
| 2017 | 1,958 | 1,918 | 2,131 | 1,838 | 2,542 | 2,629 | 1,356 | 672 | 1,387 | 806 | 702 | 856 |
| 2018 | 1,443 | 816 | 1,376 | 1,295 | 1,761 | 1,385 | 347 | 696 | 872 | 1,011 | 713 | 1,061 |
| 2019 | 554 | 464 | 1,138 | 308 | 764 | 588 | 719 | 658 | 1,710 | 423 | 1,483 | 1,292 |
| 2020 | 1,893 | 1,826 | 691 | 1,193 | 1,748 | 1,436 | 1,116 | 1,024 | 2,059 | 672 | 1,481 | 1,757 |
| 2021 | 2,211 | 832 | 1,251 | 1,953 | 2,459 | 1,664 | 2,307 | 2,112 | 2,375 | 2,080 | 3,330 | 2,964 |
| 2022 | 1,710 | 2,143 | 1,764 | 2,326 | 2,486 | 2,485 | 2,243 | 1,953 | 3,090 | 1,923 | 2,133 | 2,613 |
| 2023 | 1,212 | 1,868 | 1,977 | 962 | 1,455 | 625 | 1,421 | 247 | 271 | 783 | 787 | 837 |
| 2024 | 1,715 | |||||||||||
| - = No Data Reported; -- = Not Applicable; NA = Not Available; W = Withheld to avoid disclosure of individual company data. |
| Release Date: 3/29/2024 |
| Next Release Date: 4/30/2024 |