|
Download Data (XLS File) |
|
||||||||
|
||||||||
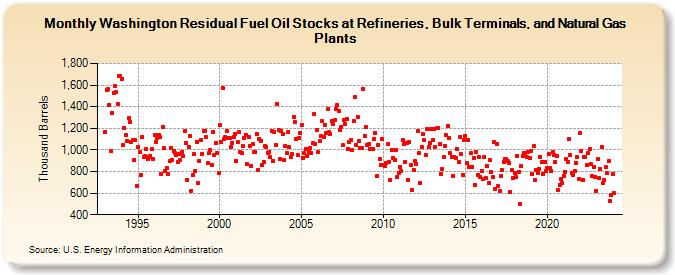
| Washington Residual Fuel Oil Stocks at Refineries, Bulk Terminals, and Natural Gas Plants (Thousand Barrels) | ||||||||
| Year | Jan | Feb | Mar | Apr | May | Jun | Jul | Aug | Sep | Oct | Nov | Dec |
|---|---|---|---|---|---|---|---|---|---|---|---|---|
| 1993 | 1,170 | 1,559 | 1,567 | 1,415 | 989 | 1,346 | 1,525 | 1,594 | 1,533 | 1,426 | 1,680 | 1,685 |
| 1994 | 1,657 | 1,045 | 1,206 | 1,139 | 1,082 | 1,291 | 1,261 | 1,069 | 1,088 | 909 | 1,093 | 668 |
| 1995 | 1,031 | 977 | 768 | 1,115 | 938 | 947 | 1,012 | 915 | 930 | 947 | 1,004 | 917 |
| 1996 | 1,137 | 1,071 | 1,112 | 1,141 | 1,122 | 778 | 1,212 | 1,017 | 807 | 833 | 776 | 895 |
| 1997 | 1,013 | 908 | 986 | 967 | 949 | 892 | 964 | 902 | 976 | 941 | 1,173 | 1,068 |
| 1998 | 724 | 1,025 | 1,129 | 623 | 767 | 958 | 801 | 1,077 | 691 | 897 | 1,095 | 966 |
| 1999 | 1,172 | 1,175 | 1,115 | 877 | 969 | 998 | 862 | 1,167 | 951 | 1,063 | 971 | 783 |
| 2000 | 1,228 | 1,071 | 1,576 | 1,098 | 1,117 | 1,173 | 1,111 | 1,106 | 1,026 | 1,064 | 1,123 | 1,149 |
| 2001 | 900 | 1,075 | 1,166 | 977 | 967 | 1,032 | 1,110 | 1,142 | 866 | 1,124 | 1,040 | 854 |
| 2002 | 1,056 | 980 | 981 | 1,147 | 814 | 1,105 | 1,078 | 859 | 890 | 1,032 | 1,027 | 975 |
| 2003 | 985 | 932 | 1,172 | 895 | 1,170 | 1,044 | 1,427 | 1,184 | 913 | 1,175 | 1,143 | 907 |
| 2004 | 1,036 | 971 | 1,168 | 1,029 | 937 | 960 | 1,309 | 1,255 | 1,103 | 953 | 1,112 | 1,158 |
| 2005 | 1,233 | 926 | 969 | 1,007 | 946 | 981 | 1,013 | 972 | 1,061 | 1,330 | 1,050 | 1,184 |
| 2006 | 980 | 1,080 | 1,126 | 1,266 | 1,121 | 1,231 | 1,157 | 1,375 | 1,163 | 1,151 | 1,266 | 1,238 |
| 2007 | 1,275 | 1,374 | 1,415 | 1,364 | 1,184 | 1,216 | 1,044 | 1,276 | 1,238 | 1,290 | 1,005 | 1,071 |
| 2008 | 1,090 | 995 | 1,272 | 1,490 | 1,046 | 1,309 | 1,086 | 1,013 | 1,013 | 1,567 | 1,131 | 1,210 |
| 2009 | 1,043 | 1,051 | 1,007 | 1,012 | 1,008 | 1,101 | 1,156 | 754 | 1,045 | 918 | 863 | 1,098 |
| 2010 | 859 | 852 | 883 | 1,052 | 890 | 720 | 995 | 929 | 908 | 1,001 | 751 | 789 |
| 2011 | 844 | 806 | 1,090 | 1,053 | 887 | 1,062 | 722 | 1,071 | 861 | 631 | 813 | 898 |
| 2012 | 865 | 1,178 | 975 | 690 | 1,023 | 1,144 | 1,089 | 956 | 1,189 | 1,029 | 1,062 | 1,197 |
| 2013 | 1,093 | 1,192 | 1,031 | 1,204 | 1,204 | 1,054 | 780 | 823 | 936 | 1,037 | 1,134 | 1,223 |
| 2014 | 1,111 | 968 | 935 | 761 | 935 | 926 | 1,010 | 885 | 1,123 | 958 | 767 | 1,088 |
| 2015 | 1,127 | 876 | 1,091 | 845 | 971 | 844 | 923 | 678 | 981 | 770 | 934 | 750 |
| 2016 | 808 | 734 | 935 | 742 | 853 | 694 | 906 | 800 | 751 | 1,071 | 641 | 1,056 |
| 2017 | 668 | 621 | 756 | 811 | 892 | 917 | 914 | 894 | 879 | 609 | 811 | 742 |
| 2018 | 786 | 753 | 943 | 798 | 500 | 849 | 941 | 975 | 960 | 933 | 979 | 926 |
| 2019 | 990 | 779 | 1,036 | 720 | 817 | 783 | 826 | 937 | 885 | 776 | 892 | 804 |
| 2020 | 830 | 959 | 829 | 804 | 985 | 951 | 891 | 944 | 627 | 678 | 731 | 694 |
| 2021 | 760 | 797 | 913 | 887 | 1,097 | 954 | 787 | 770 | 801 | 880 | 931 | 733 |
| 2022 | 1,155 | 988 | 722 | 930 | 935 | 857 | 972 | 1,005 | 866 | 760 | 842 | 752 |
| 2023 | 617 | 916 | 738 | 825 | 1,028 | 697 | 718 | 842 | 786 | 898 | 528 | 582 |
| 2024 | 778 | |||||||||||
| - = No Data Reported; -- = Not Applicable; NA = Not Available; W = Withheld to avoid disclosure of individual company data. |
| Release Date: 3/29/2024 |
| Next Release Date: 4/30/2024 |