|
Download Data (XLS File) |
|
||||||||
|
||||||||
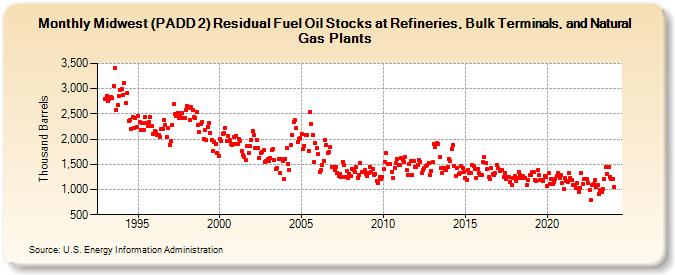
| Midwest (PADD 2) Residual Fuel Oil Stocks at Refineries, Bulk Terminals, and Natural Gas Plants (Thousand Barrels) | ||||||||
| Year | Jan | Feb | Mar | Apr | May | Jun | Jul | Aug | Sep | Oct | Nov | Dec |
|---|---|---|---|---|---|---|---|---|---|---|---|---|
| 1993 | 2,805 | 2,852 | 2,758 | 2,800 | 2,833 | 2,823 | 3,052 | 3,411 | 2,584 | 2,675 | 2,849 | 2,979 |
| 1994 | 2,985 | 2,881 | 3,116 | 2,715 | 2,908 | 2,359 | 2,374 | 2,210 | 2,448 | 2,214 | 2,420 | 2,249 |
| 1995 | 2,461 | 2,343 | 2,179 | 2,312 | 2,172 | 2,444 | 2,322 | 2,259 | 2,331 | 2,438 | 2,252 | 2,108 |
| 1996 | 2,164 | 2,149 | 2,075 | 2,073 | 2,048 | 2,204 | 2,199 | 2,379 | 2,270 | 2,050 | 2,217 | 1,891 |
| 1997 | 1,955 | 2,281 | 2,706 | 2,490 | 2,465 | 2,527 | 2,427 | 2,477 | 2,512 | 2,415 | 2,414 | 2,585 |
| 1998 | 2,649 | 2,608 | 2,384 | 2,631 | 2,573 | 2,442 | 2,426 | 2,534 | 2,279 | 2,136 | 2,306 | 2,335 |
| 1999 | 2,004 | 2,178 | 1,977 | 2,238 | 2,323 | 2,126 | 1,980 | 1,756 | 1,951 | 1,900 | 1,722 | 1,660 |
| 2000 | 2,001 | 1,957 | 2,107 | 2,116 | 2,219 | 1,966 | 2,056 | 1,977 | 1,909 | 1,877 | 2,034 | 1,903 |
| 2001 | 2,062 | 1,911 | 1,999 | 1,971 | 1,765 | 1,694 | 1,653 | 1,579 | 1,867 | 1,722 | 1,860 | 1,991 |
| 2002 | 2,163 | 2,075 | 1,825 | 1,988 | 1,824 | 1,628 | 1,716 | 1,736 | 1,774 | 1,553 | 1,570 | 1,596 |
| 2003 | 1,565 | 1,630 | 1,777 | 1,798 | 1,578 | 1,408 | 1,423 | 1,608 | 1,327 | 1,600 | 1,571 | 1,216 |
| 2004 | 1,610 | 1,818 | 1,503 | 1,385 | 1,885 | 2,091 | 2,334 | 2,373 | 2,218 | 1,941 | 2,010 | 2,017 |
| 2005 | 2,110 | 1,802 | 1,871 | 2,072 | 2,089 | 1,770 | 2,546 | 2,294 | 2,085 | 1,542 | 1,932 | 1,814 |
| 2006 | 1,707 | 1,349 | 1,386 | 1,481 | 1,572 | 1,975 | 1,889 | 1,730 | 1,743 | 1,842 | 1,444 | 1,444 |
| 2007 | 1,384 | 1,447 | 1,323 | 1,263 | 1,311 | 1,246 | 1,548 | 1,492 | 1,244 | 1,374 | 1,233 | 1,316 |
| 2008 | 1,269 | 1,416 | 1,393 | 1,344 | 1,438 | 1,236 | 1,285 | 1,526 | 1,351 | 1,347 | 1,380 | 1,307 |
| 2009 | 1,276 | 1,324 | 1,452 | 1,341 | 1,404 | 1,282 | 1,305 | 1,160 | 1,136 | 1,242 | 1,210 | 1,255 |
| 2010 | 1,406 | 1,547 | 1,717 | 1,513 | 1,512 | 1,505 | 1,353 | 1,231 | 1,430 | 1,523 | 1,605 | 1,477 |
| 2011 | 1,493 | 1,617 | 1,593 | 1,537 | 1,637 | 1,380 | 1,283 | 1,503 | 1,556 | 1,285 | 1,561 | 1,448 |
| 2012 | 1,442 | 1,495 | 1,580 | 1,554 | 1,324 | 1,390 | 1,426 | 1,461 | 1,493 | 1,527 | 1,290 | 1,377 |
| 2013 | 1,547 | 1,908 | 1,834 | 1,914 | 1,901 | 1,637 | 1,431 | 1,318 | 1,426 | 1,416 | 1,381 | 1,452 |
| 2014 | 1,606 | 1,558 | 1,807 | 1,875 | 1,465 | 1,277 | 1,417 | 1,314 | 1,335 | 1,469 | 1,432 | 1,346 |
| 2015 | 1,234 | 1,196 | 1,396 | 1,334 | 1,326 | 1,496 | 1,473 | 1,408 | 1,234 | 1,415 | 1,318 | 1,293 |
| 2016 | 1,279 | 1,550 | 1,643 | 1,534 | 1,398 | 1,251 | 1,211 | 1,419 | 1,305 | 1,295 | 1,328 | 1,489 |
| 2017 | 1,419 | 1,359 | 1,393 | 1,387 | 1,248 | 1,328 | 1,208 | 1,249 | 1,251 | 1,149 | 1,081 | 1,234 |
| 2018 | 1,261 | 1,166 | 1,235 | 1,341 | 1,291 | 1,238 | 1,261 | 1,237 | 1,230 | 1,091 | 1,193 | 1,280 |
| 2019 | 1,297 | 1,345 | 1,347 | 1,189 | 1,175 | 1,385 | 1,279 | 1,184 | 1,186 | 1,176 | 1,276 | 1,247 |
| 2020 | 1,069 | 1,321 | 1,115 | 1,199 | 1,111 | 1,153 | 1,215 | 1,271 | 1,335 | 1,219 | 1,286 | 1,129 |
| 2021 | 1,014 | 1,221 | 1,169 | 1,150 | 1,328 | 1,235 | 1,195 | 1,094 | 1,098 | 1,022 | 1,124 | 957 |
| 2022 | 1,039 | 1,318 | 1,112 | 1,203 | 1,214 | 1,203 | 1,125 | 999 | 792 | 1,094 | 1,100 | 1,188 |
| 2023 | 1,059 | 1,086 | 909 | 986 | 949 | 1,008 | 1,215 | 1,447 | 1,317 | 1,441 | 1,253 | 1,214 |
| 2024 | 1,205 | |||||||||||
| - = No Data Reported; -- = Not Applicable; NA = Not Available; W = Withheld to avoid disclosure of individual company data. |
| Release Date: 3/29/2024 |
| Next Release Date: 4/30/2024 |