|
Download Data (XLS File) |
|
||||||||
|
||||||||
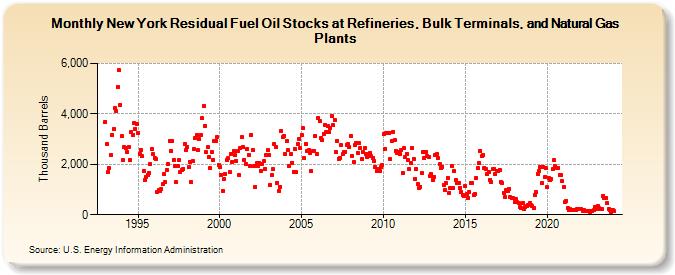
| New York Residual Fuel Oil Stocks at Refineries, Bulk Terminals, and Natural Gas Plants (Thousand Barrels) | ||||||||
| Year | Jan | Feb | Mar | Apr | May | Jun | Jul | Aug | Sep | Oct | Nov | Dec |
|---|---|---|---|---|---|---|---|---|---|---|---|---|
| 1993 | 3,698 | 2,808 | 1,687 | 1,842 | 2,369 | 3,167 | 3,406 | 4,221 | 4,103 | 5,083 | 5,725 | 4,356 |
| 1994 | 3,118 | 2,160 | 2,673 | 2,636 | 2,499 | 2,694 | 2,179 | 3,264 | 3,167 | 3,644 | 3,404 | 3,617 |
| 1995 | 3,260 | 2,419 | 2,580 | 2,317 | 1,741 | 1,378 | 1,513 | 1,583 | 1,668 | 2,010 | 2,616 | 2,392 |
| 1996 | 2,258 | 2,196 | 883 | 978 | 927 | 1,021 | 1,205 | 1,611 | 1,289 | 1,777 | 2,003 | 2,930 |
| 1997 | 2,521 | 2,911 | 2,172 | 1,949 | 1,286 | 1,914 | 2,169 | 1,711 | 1,774 | 1,833 | 2,808 | 2,553 |
| 1998 | 2,705 | 1,876 | 2,105 | 1,290 | 2,135 | 2,615 | 3,036 | 3,163 | 2,554 | 2,998 | 3,182 | 3,823 |
| 1999 | 4,310 | 3,539 | 2,471 | 2,667 | 2,281 | 1,854 | 2,488 | 2,181 | 2,911 | 2,928 | 3,070 | 1,981 |
| 2000 | 1,892 | 1,591 | 947 | 1,425 | 1,633 | 2,186 | 2,239 | 1,683 | 2,395 | 2,102 | 2,527 | 2,363 |
| 2001 | 2,143 | 2,511 | 1,571 | 2,634 | 3,064 | 2,689 | 2,189 | 2,013 | 2,591 | 2,371 | 1,934 | 3,176 |
| 2002 | 2,567 | 1,923 | 1,105 | 2,042 | 1,937 | 2,066 | 1,751 | 2,017 | 2,120 | 1,815 | 2,364 | 2,553 |
| 2003 | 2,357 | 1,183 | 1,560 | 1,798 | 2,810 | 2,668 | 1,277 | 938 | 1,114 | 3,328 | 3,070 | 3,141 |
| 2004 | 2,402 | 2,923 | 2,565 | 1,937 | 2,396 | 2,057 | 1,708 | 2,616 | 1,683 | 2,810 | 3,022 | 2,643 |
| 2005 | 3,163 | 3,426 | 2,249 | 2,822 | 2,508 | 2,548 | 2,459 | 1,720 | 2,520 | 2,528 | 3,130 | 2,417 |
| 2006 | 3,854 | 3,705 | 3,039 | 2,970 | 3,208 | 3,573 | 3,265 | 3,537 | 3,262 | 3,443 | 3,903 | 3,551 |
| 2007 | 3,775 | 2,482 | 2,937 | 2,213 | 2,264 | 2,756 | 2,389 | 2,489 | 2,498 | 2,785 | 2,803 | 2,686 |
| 2008 | 3,130 | 2,333 | 2,094 | 2,763 | 2,829 | 2,453 | 2,826 | 2,641 | 2,202 | 2,495 | 2,662 | 2,392 |
| 2009 | 2,307 | 2,411 | 2,454 | 2,311 | 2,269 | 2,127 | 1,909 | 1,746 | 1,820 | 1,725 | 1,902 | 1,963 |
| 2010 | 3,186 | 2,611 | 3,259 | 3,236 | 3,258 | 2,198 | 2,938 | 3,289 | 2,962 | 2,547 | 2,448 | 2,472 |
| 2011 | 2,414 | 2,558 | 1,655 | 2,629 | 2,284 | 2,416 | 2,153 | 1,797 | 2,069 | 2,640 | 2,228 | 1,431 |
| 2012 | 1,806 | 1,218 | 1,057 | 1,103 | 1,640 | 2,498 | 2,242 | 2,492 | 2,337 | 2,289 | 1,551 | 1,607 |
| 2013 | 1,381 | 1,504 | 2,361 | 2,418 | 2,248 | 2,000 | 1,852 | 1,904 | 1,195 | 965 | 1,251 | 1,466 |
| 2014 | 865 | 1,047 | 1,921 | 1,052 | 1,729 | 1,390 | 1,252 | 1,256 | 1,077 | 919 | 794 | 744 |
| 2015 | 1,146 | 806 | 656 | 914 | 1,259 | 1,257 | 780 | 824 | 1,450 | 1,838 | 2,036 | 2,535 |
| 2016 | 2,310 | 2,363 | 1,861 | 1,816 | 1,625 | 1,693 | 1,393 | 1,285 | 1,798 | 1,819 | 1,632 | 1,717 |
| 2017 | 1,725 | 1,776 | 1,312 | 1,261 | 865 | 709 | 977 | 928 | 1,034 | 686 | 650 | 654 |
| 2018 | 515 | 611 | 491 | 467 | 297 | 252 | 447 | 221 | 307 | 332 | 397 | 446 |
| 2019 | 388 | 344 | 276 | 789 | 888 | 1,617 | 1,728 | 1,881 | 1,242 | 1,902 | 1,493 | 1,851 |
| 2020 | 1,080 | 1,462 | 1,384 | 1,399 | 1,795 | 2,158 | 1,918 | 1,868 | 1,873 | 1,582 | 1,558 | 1,320 |
| 2021 | 1,106 | 485 | 556 | 283 | 199 | 207 | 187 | 190 | 177 | 195 | 243 | 219 |
| 2022 | 207 | 207 | 164 | 174 | 157 | 139 | 153 | 122 | 158 | 146 | 169 | 308 |
| 2023 | 234 | 347 | 269 | 233 | 210 | 745 | 659 | 662 | 451 | 219 | 183 | 117 |
| 2024 | 185 | |||||||||||
| - = No Data Reported; -- = Not Applicable; NA = Not Available; W = Withheld to avoid disclosure of individual company data. |
| Release Date: 3/29/2024 |
| Next Release Date: 4/30/2024 |