|
Download Data (XLS File) |
|
||||||||
|
||||||||
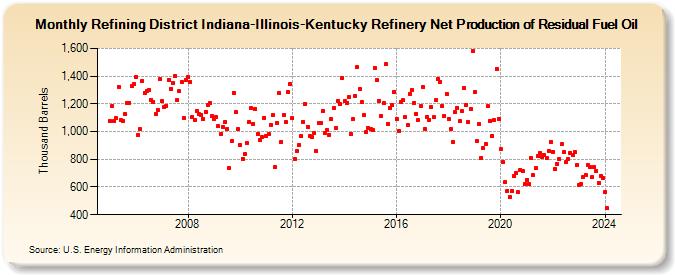
| Refining District Indiana-Illinois-Kentucky Refinery Net Production of Residual Fuel Oil (Thousand Barrels) | ||||||||
| Year | Jan | Feb | Mar | Apr | May | Jun | Jul | Aug | Sep | Oct | Nov | Dec |
|---|---|---|---|---|---|---|---|---|---|---|---|---|
| 2005 | 1,075 | 1,185 | 1,074 | 1,095 | 1,324 | 1,084 | 1,078 | 1,129 | 1,205 | 1,208 | 1,326 | 1,342 |
| 2006 | 1,392 | 978 | 1,016 | 1,367 | 1,279 | 1,295 | 1,301 | 1,228 | 1,214 | 1,127 | 1,158 | 1,377 |
| 2007 | 1,219 | 1,180 | 1,187 | 1,374 | 1,309 | 1,351 | 1,400 | 1,228 | 1,290 | 1,357 | 1,101 | 1,369 |
| 2008 | 1,391 | 1,359 | 1,106 | 1,082 | 1,150 | 1,127 | 1,121 | 1,093 | 1,144 | 1,194 | 1,205 | 1,111 |
| 2009 | 1,091 | 1,104 | 1,040 | 981 | 1,035 | 1,069 | 1,017 | 736 | 931 | 1,279 | 1,139 | 1,016 |
| 2010 | 905 | 804 | 837 | 920 | 1,068 | 1,167 | 1,055 | 1,163 | 981 | 937 | 959 | 1,101 |
| 2011 | 971 | 980 | 1,048 | 1,121 | 742 | 1,063 | 1,277 | 926 | 1,123 | 1,070 | 1,287 | 1,346 |
| 2012 | 1,097 | 801 | 858 | 904 | 966 | 1,072 | 1,197 | 1,034 | 968 | 962 | 991 | 859 |
| 2013 | 1,060 | 1,062 | 1,149 | 986 | 1,012 | 978 | 1,090 | 1,169 | 1,027 | 1,218 | 1,198 | 1,387 |
| 2014 | 1,218 | 1,209 | 1,249 | 985 | 1,087 | 1,258 | 1,464 | 1,308 | 1,210 | 1,119 | 997 | 1,025 |
| 2015 | 1,017 | 1,010 | 1,460 | 1,370 | 1,222 | 1,111 | 1,205 | 1,485 | 1,056 | 1,170 | 1,189 | 1,288 |
| 2016 | 1,091 | 1,005 | 1,213 | 1,225 | 1,102 | 1,046 | 1,273 | 1,297 | 1,207 | 1,129 | 1,081 | 1,183 |
| 2017 | 1,320 | 1,019 | 1,107 | 1,084 | 1,174 | 1,102 | 1,225 | 1,377 | 1,361 | 1,185 | 1,111 | 1,274 |
| 2018 | 1,094 | 1,021 | 922 | 1,140 | 1,172 | 1,074 | 1,145 | 1,314 | 1,192 | 1,069 | 1,162 | 1,584 |
| 2019 | 1,286 | 931 | 1,054 | 812 | 879 | 911 | 1,183 | 1,077 | 968 | 1,083 | 1,453 | 1,094 |
| 2020 | 872 | 779 | 636 | 573 | 526 | 568 | 679 | 703 | 561 | 724 | 713 | 623 |
| 2021 | 653 | 624 | 806 | 683 | 734 | 823 | 847 | 817 | 830 | 807 | 863 | 927 |
| 2022 | 855 | 730 | 767 | 801 | 908 | 850 | 778 | 803 | 847 | 834 | 851 | 758 |
| 2023 | 616 | 624 | 673 | 689 | 756 | 741 | 669 | 745 | 717 | 629 | 680 | 665 |
| 2024 | 567 | |||||||||||
| - = No Data Reported; -- = Not Applicable; NA = Not Available; W = Withheld to avoid disclosure of individual company data. |
| Release Date: 3/29/2024 |
| Next Release Date: 4/30/2024 |