|
Download Data (XLS File) |
|
||||||||
|
||||||||
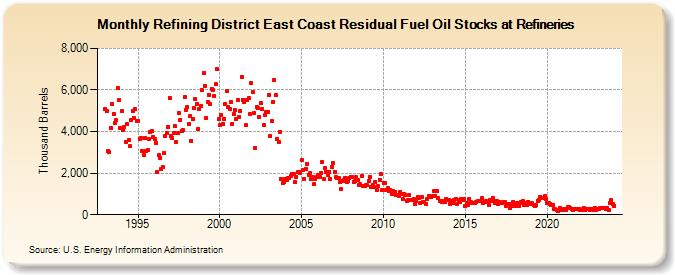
| Refining District East Coast Residual Fuel Oil Stocks at Refineries (Thousand Barrels) | ||||||||
| Year | Jan | Feb | Mar | Apr | May | Jun | Jul | Aug | Sep | Oct | Nov | Dec |
|---|---|---|---|---|---|---|---|---|---|---|---|---|
| 1993 | 5,100 | 4,973 | 3,065 | 3,006 | 4,189 | 5,324 | 4,855 | 4,433 | 4,540 | 6,085 | 5,530 | 4,160 |
| 1994 | 4,976 | 4,057 | 4,235 | 3,518 | 4,358 | 3,574 | 3,284 | 4,569 | 4,997 | 4,652 | 5,071 | 4,526 |
| 1995 | 4,493 | 3,663 | 3,675 | 3,064 | 2,869 | 3,693 | 3,058 | 3,094 | 3,646 | 3,977 | 4,010 | 3,740 |
| 1996 | 3,627 | 3,428 | 2,058 | 2,855 | 2,746 | 2,207 | 2,285 | 2,975 | 3,807 | 3,932 | 4,240 | 5,628 |
| 1997 | 3,781 | 3,672 | 3,930 | 4,245 | 3,499 | 3,925 | 4,883 | 4,557 | 4,039 | 4,073 | 5,654 | 5,039 |
| 1998 | 5,170 | 4,376 | 4,732 | 3,562 | 4,591 | 5,122 | 5,587 | 5,305 | 4,131 | 5,076 | 5,230 | 5,986 |
| 1999 | 6,817 | 6,169 | 4,675 | 5,422 | 5,772 | 5,309 | 6,055 | 6,003 | 5,701 | 6,268 | 7,005 | 4,603 |
| 2000 | 4,326 | 4,793 | 4,366 | 4,619 | 5,333 | 5,951 | 5,184 | 5,097 | 5,431 | 4,359 | 4,836 | 5,022 |
| 2001 | 4,613 | 5,527 | 4,709 | 5,012 | 6,631 | 5,535 | 5,409 | 4,297 | 5,521 | 5,596 | 4,826 | 6,331 |
| 2002 | 5,880 | 4,885 | 3,212 | 5,180 | 5,120 | 4,691 | 5,354 | 5,065 | 4,312 | 4,788 | 4,928 | 4,917 |
| 2003 | 5,777 | 3,804 | 4,487 | 5,432 | 6,474 | 5,770 | 3,638 | 3,516 | 3,985 | 1,717 | 1,512 | 1,559 |
| 2004 | 1,709 | 1,673 | 1,776 | 1,772 | 1,886 | 1,966 | 1,952 | 1,591 | 1,828 | 2,036 | 2,068 | 2,020 |
| 2005 | 2,625 | 2,128 | 1,720 | 2,207 | 2,457 | 1,919 | 1,984 | 1,704 | 1,822 | 1,465 | 1,704 | 1,829 |
| 2006 | 1,888 | 1,833 | 2,014 | 2,551 | 1,704 | 2,224 | 2,043 | 1,896 | 2,076 | 1,741 | 2,309 | 2,486 |
| 2007 | 2,067 | 1,814 | 1,748 | 1,761 | 1,553 | 1,221 | 1,641 | 1,674 | 1,771 | 1,568 | 1,642 | 1,742 |
| 2008 | 1,809 | 1,797 | 1,595 | 1,602 | 1,793 | 1,684 | 1,429 | 1,465 | 1,883 | 1,359 | 1,368 | 1,408 |
| 2009 | 1,412 | 1,644 | 1,826 | 1,309 | 1,453 | 1,334 | 1,577 | 1,209 | 1,369 | 1,687 | 1,947 | 1,193 |
| 2010 | 1,544 | 1,510 | 1,203 | 1,261 | 1,128 | 1,179 | 1,005 | 1,137 | 1,084 | 970 | 950 | 905 |
| 2011 | 1,090 | 998 | 743 | 986 | 927 | 680 | 695 | 940 | 720 | 691 | 748 | 496 |
| 2012 | 673 | 841 | 817 | 551 | 835 | 613 | 619 | 533 | 777 | 919 | 863 | 831 |
| 2013 | 884 | 1,130 | 886 | 1,120 | 787 | 670 | 659 | 606 | 667 | 631 | 746 | 712 |
| 2014 | 725 | 533 | 657 | 586 | 707 | 759 | 530 | 691 | 594 | 771 | 717 | 747 |
| 2015 | 420 | 560 | 477 | 732 | 590 | 574 | 577 | 570 | 629 | 650 | 642 | 643 |
| 2016 | 790 | 587 | 622 | 647 | 605 | 484 | 692 | 642 | 811 | 661 | 559 | 671 |
| 2017 | 498 | 588 | 571 | 580 | 613 | 602 | 435 | 522 | 526 | 339 | 410 | 629 |
| 2018 | 539 | 425 | 544 | 431 | 574 | 589 | 640 | 490 | 550 | 490 | 635 | 509 |
| 2019 | 530 | 544 | 449 | 433 | 447 | 677 | 707 | 856 | 825 | 824 | 891 | 748 |
| 2020 | 552 | 584 | 533 | 480 | 485 | 279 | 252 | 244 | 176 | 325 | 232 | 234 |
| 2021 | 260 | 287 | 208 | 352 | 371 | 302 | 279 | 250 | 252 | 285 | 258 | 261 |
| 2022 | 249 | 220 | 265 | 320 | 203 | 291 | 295 | 207 | 284 | 276 | 227 | 347 |
| 2023 | 239 | 272 | 263 | 319 | 315 | 345 | 301 | 256 | 304 | 214 | 549 | 703 |
| 2024 | 526 | |||||||||||
| - = No Data Reported; -- = Not Applicable; NA = Not Available; W = Withheld to avoid disclosure of individual company data. |
| Release Date: 3/29/2024 |
| Next Release Date: 4/30/2024 |
Referring Pages: