|
Download Data (XLS File) |
|
||||||||
|
||||||||
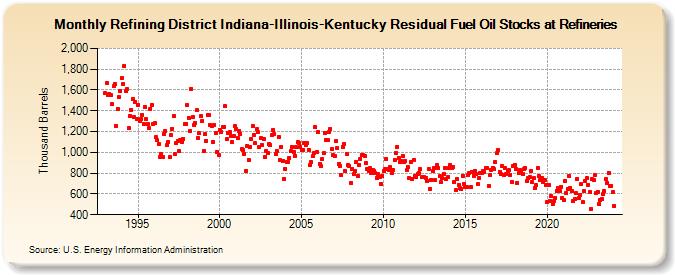
| Refining District Indiana-Illinois-Kentucky Residual Fuel Oil Stocks at Refineries (Thousand Barrels) | ||||||||
| Year | Jan | Feb | Mar | Apr | May | Jun | Jul | Aug | Sep | Oct | Nov | Dec |
|---|---|---|---|---|---|---|---|---|---|---|---|---|
| 1993 | 1,569 | 1,670 | 1,548 | 1,560 | 1,547 | 1,465 | 1,634 | 1,662 | 1,258 | 1,420 | 1,532 | 1,586 |
| 1994 | 1,717 | 1,659 | 1,826 | 1,588 | 1,608 | 1,233 | 1,354 | 1,410 | 1,513 | 1,336 | 1,486 | 1,323 |
| 1995 | 1,456 | 1,297 | 1,321 | 1,364 | 1,276 | 1,436 | 1,320 | 1,272 | 1,230 | 1,420 | 1,459 | 1,276 |
| 1996 | 1,282 | 1,144 | 1,115 | 1,082 | 958 | 980 | 958 | 1,174 | 1,205 | 1,069 | 1,104 | 951 |
| 1997 | 1,163 | 1,227 | 1,353 | 984 | 1,087 | 1,113 | 1,011 | 1,117 | 1,102 | 1,131 | 1,268 | 1,277 |
| 1998 | 1,451 | 1,333 | 1,204 | 1,611 | 1,338 | 1,261 | 1,280 | 1,403 | 1,141 | 1,183 | 1,347 | 1,302 |
| 1999 | 1,014 | 1,174 | 1,113 | 1,359 | 1,359 | 1,264 | 1,254 | 1,098 | 1,265 | 1,186 | 1,008 | 978 |
| 2000 | 1,214 | 1,200 | 1,244 | 1,248 | 1,441 | 1,128 | 1,185 | 1,191 | 1,158 | 1,100 | 1,155 | 1,250 |
| 2001 | 1,227 | 1,138 | 1,207 | 1,179 | 1,030 | 1,022 | 982 | 822 | 1,061 | 929 | 1,056 | 1,131 |
| 2002 | 1,257 | 1,171 | 1,086 | 1,224 | 1,192 | 1,049 | 1,134 | 1,070 | 1,133 | 960 | 1,011 | 991 |
| 2003 | 1,081 | 1,070 | 1,167 | 1,216 | 1,175 | 985 | 1,010 | 1,148 | 929 | 1,056 | 918 | 746 |
| 2004 | 842 | 911 | 910 | 948 | 1,012 | 1,055 | 1,008 | 969 | 1,047 | 1,099 | 1,089 | 1,053 |
| 2005 | 1,021 | 1,023 | 1,090 | 1,075 | 1,089 | 1,025 | 874 | 906 | 961 | 998 | 1,240 | 1,008 |
| 2006 | 1,199 | 892 | 865 | 935 | 991 | 1,190 | 1,121 | 1,117 | 1,195 | 1,226 | 1,030 | 970 |
| 2007 | 969 | 1,108 | 1,042 | 888 | 872 | 780 | 1,056 | 1,082 | 817 | 980 | 874 | 869 |
| 2008 | 706 | 838 | 792 | 819 | 910 | 775 | 881 | 939 | 979 | 970 | 967 | 897 |
| 2009 | 842 | 821 | 849 | 800 | 832 | 824 | 803 | 754 | 789 | 760 | 696 | 773 |
| 2010 | 823 | 838 | 939 | 840 | 831 | 858 | 799 | 828 | 931 | 993 | 1,055 | 946 |
| 2011 | 904 | 919 | 964 | 911 | 921 | 827 | 855 | 750 | 908 | 743 | 930 | 769 |
| 2012 | 759 | 795 | 800 | 835 | 762 | 760 | 762 | 757 | 729 | 838 | 649 | 738 |
| 2013 | 819 | 849 | 731 | 880 | 853 | 768 | 710 | 752 | 794 | 852 | 740 | 760 |
| 2014 | 851 | 877 | 851 | 859 | 712 | 633 | 742 | 690 | 654 | 647 | 777 | 694 |
| 2015 | 667 | 663 | 779 | 804 | 663 | 811 | 773 | 823 | 790 | 693 | 754 | 798 |
| 2016 | 799 | 819 | 812 | 853 | 846 | 681 | 780 | 830 | 854 | 837 | 905 | 993 |
| 2017 | 1,022 | 813 | 796 | 865 | 785 | 847 | 794 | 824 | 829 | 785 | 714 | 866 |
| 2018 | 882 | 842 | 708 | 799 | 827 | 813 | 792 | 838 | 850 | 727 | 750 | 761 |
| 2019 | 819 | 716 | 750 | 658 | 683 | 850 | 768 | 737 | 757 | 716 | 735 | 687 |
| 2020 | 522 | 685 | 530 | 579 | 502 | 529 | 565 | 631 | 654 | 626 | 671 | 565 |
| 2021 | 540 | 728 | 607 | 647 | 771 | 654 | 630 | 535 | 550 | 607 | 742 | 557 |
| 2022 | 592 | 692 | 522 | 624 | 725 | 749 | 689 | 614 | 458 | 740 | 730 | 779 |
| 2023 | 606 | 623 | 507 | 542 | 551 | 595 | 624 | 739 | 707 | 805 | 678 | 642 |
| 2024 | 614 | 487 | 623 | 665 | 714 | 619 | ||||||
| - = No Data Reported; -- = Not Applicable; NA = Not Available; W = Withheld to avoid disclosure of individual company data. |
| Release Date: 8/30/2024 |
| Next Release Date: 9/30/2024 |