|
Download Data (XLS File) |
|
||||||||
|
||||||||
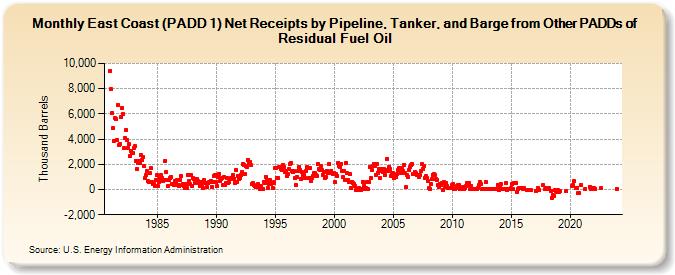
| East Coast (PADD 1) Net Receipts by Pipeline, Tanker, and Barge from Other PADDs of Residual Fuel Oil (Thousand Barrels) | ||||||||
| Year | Jan | Feb | Mar | Apr | May | Jun | Jul | Aug | Sep | Oct | Nov | Dec |
|---|---|---|---|---|---|---|---|---|---|---|---|---|
| 1981 | 9,419 | 7,973 | 6,051 | 4,843 | 3,883 | 5,642 | 5,596 | 3,940 | 6,709 | 3,502 | 3,622 | 5,773 |
| 1982 | 6,487 | 5,959 | 3,283 | 4,058 | 4,733 | 3,905 | 3,328 | 3,572 | 2,623 | 3,087 | 2,859 | 2,877 |
| 1983 | 3,313 | 3,421 | 2,298 | 1,622 | 2,132 | 2,261 | 2,106 | 2,768 | 2,349 | 2,561 | 1,863 | 897 |
| 1984 | 1,139 | 1,450 | 651 | 610 | 1,297 | 1,675 | 612 | 435 | 440 | 313 | 743 | 1,133 |
| 1985 | 301 | 617 | 827 | 755 | 1,145 | 896 | 639 | 756 | 2,264 | 1,379 | 748 | 283 |
| 1986 | 743 | 935 | 1,021 | 402 | 412 | 397 | 689 | 628 | 738 | 368 | 251 | 775 |
| 1987 | 1,090 | 374 | 463 | 289 | 92 | 415 | 128 | 1,182 | 672 | 404 | 1,169 | 268 |
| 1988 | 891 | 840 | 537 | 742 | 826 | 665 | 486 | 288 | 596 | 449 | 103 | 736 |
| 1989 | 549 | 539 | 238 | 513 | 574 | 562 | 714 | 227 | 572 | 1,052 | 1,135 | 633 |
| 1990 | 255 | 1,143 | 1,002 | 1,253 | 664 | 820 | 933 | 396 | 1,028 | 389 | 522 | 914 |
| 1991 | 516 | 568 | 815 | 883 | 894 | 1,156 | 855 | 548 | 1,560 | 603 | 1,106 | 826 |
| 1992 | 917 | 1,183 | 1,403 | 2,005 | 1,984 | 1,219 | 1,892 | 1,803 | 2,338 | 2,069 | 2,215 | 1,923 |
| 1993 | 407 | 491 | 370 | 242 | 212 | 239 | 420 | 275 | 73 | 273 | 52 | 30 |
| 1994 | 615 | 554 | 1,020 | 739 | 150 | 459 | 794 | 447 | 488 | 126 | 566 | 544 |
| 1995 | 1,733 | 1,698 | 892 | 922 | 1,762 | 1,795 | 1,636 | 1,583 | 1,961 | 1,762 | 1,369 | 1,432 |
| 1996 | 1,083 | 1,233 | 1,662 | 2,018 | 2,112 | 1,475 | 1,394 | 1,438 | 921 | 340 | 975 | 1,485 |
| 1997 | 1,816 | 1,545 | 859 | 1,351 | 1,127 | 1,178 | 943 | 1,444 | 1,779 | 1,705 | 935 | 1,743 |
| 1998 | 704 | 903 | 1,066 | 1,290 | 1,320 | 1,143 | 1,107 | 2,033 | 1,591 | 1,549 | 1,834 | 1,584 |
| 1999 | 1,159 | 1,351 | 930 | 1,018 | 1,504 | 1,377 | 1,321 | 2,028 | 1,363 | 1,506 | 1,306 | 1,258 |
| 2000 | 1,297 | 558 | 1,196 | 1,089 | 2,106 | 1,861 | 1,822 | 2,037 | 1,454 | 989 | 1,433 | 769 |
| 2001 | 2,142 | 1,286 | 764 | 569 | 1,207 | 123 | 624 | 526 | 445 | 295 | 0 | 0 |
| 2002 | 0 | 87 | 15 | 0 | 15 | 602 | 286 | 69 | 105 | 569 | 24 | 605 |
| 2003 | 1,782 | 927 | 1,528 | 1,898 | 2,047 | 1,830 | 1,132 | 2,051 | 1,344 | 1,631 | 906 | 1,439 |
| 2004 | 1,638 | 1,391 | 1,652 | 1,129 | 1,436 | 1,511 | 2,422 | 1,479 | 1,812 | 1,623 | 1,045 | 1,289 |
| 2005 | 1,292 | 902 | 1,015 | 1,003 | 1,250 | 1,587 | 1,678 | 1,729 | 1,285 | 1,663 | 1,468 | 1,984 |
| 2006 | 1,276 | 165 | 1,118 | 1,028 | 1,540 | 1,800 | 1,968 | 2,020 | 1,209 | 1,223 | 1,414 | 1,274 |
| 2007 | 1,180 | 1,127 | 991 | 1,120 | 1,441 | 2,015 | 1,631 | 1,869 | 900 | 1,051 | 951 | 673 |
| 2008 | 114 | 64 | 433 | 832 | 1,182 | 1,225 | 1,137 | 823 | 781 | 375 | 210 | 422 |
| 2009 | 378 | 499 | -6 | 575 | 551 | 203 | 492 | 278 | 123 | 122 | 120 | |
| 2010 | 388 | 473 | 6 | 7 | 101 | 296 | 349 | 374 | 7 | 14 | 14 | 208 |
| 2011 | 12 | 116 | 240 | 555 | 392 | 507 | 15 | 287 | 21 | 15 | 22 | 15 |
| 2012 | 22 | 16 | 124 | 384 | 599 | 463 | 6 | 19 | 31 | 14 | 612 | 7 |
| 2013 | 15 | 15 | 14 | 17 | 17 | 14 | 15 | 14 | 7 | 7 | 374 | -51 |
| 2014 | 205 | 464 | 8 | 9 | 15 | 533 | -54 | 7 | 14 | |||
| 2015 | 105 | 436 | 13 | 483 | 546 | -188 | 59 | 118 | 107 | |||
| 2016 | 76 | 115 | -42 | -72 | -72 | |||||||
| 2017 | -103 | 129 | -17 | 340 | 20 | 99 | ||||||
| 2018 | 70 | 94 | -119 | -637 | -428 | -550 | -75 | -116 | -166 | -71 | ||
| 2019 | -218 | -129 | -121 | |||||||||
| 2020 | 308 | 338 | 643 | 107 | 125 | -297 | -261 | 365 | ||||
| 2021 | 49 | 228 | 45 | 87 | 27 | |||||||
| 2022 | 92 | 80 | 93 | |||||||||
| 2023 | 57 | |||||||||||
| - = No Data Reported; -- = Not Applicable; NA = Not Available; W = Withheld to avoid disclosure of individual company data. |
| Release Date: 3/29/2024 |
| Next Release Date: 4/30/2024 |