|
Download Data (XLS File) |
|
||||||||
|
||||||||
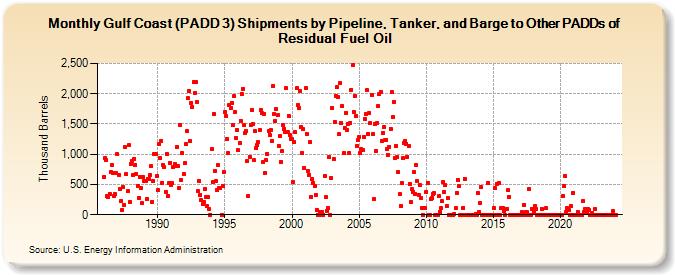
| Gulf Coast (PADD 3) Shipments by Pipeline, Tanker, and Barge to Other PADDs of Residual Fuel Oil (Thousand Barrels) | ||||||||
| Year | Jan | Feb | Mar | Apr | May | Jun | Jul | Aug | Sep | Oct | Nov | Dec |
|---|---|---|---|---|---|---|---|---|---|---|---|---|
| 1986 | 630 | 932 | 903 | 311 | 299 | 345 | 702 | 824 | 694 | 312 | 340 | 686 |
| 1987 | 997 | 653 | 427 | 219 | 75 | 458 | 167 | 1,114 | 672 | 385 | 1,145 | 217 |
| 1988 | 846 | 886 | 654 | 927 | 825 | 678 | 482 | 276 | 619 | 449 | 192 | 627 |
| 1989 | 553 | 561 | 267 | 596 | 587 | 651 | 801 | 214 | 557 | 1,007 | 1,005 | 633 |
| 1990 | 405 | 1,167 | 938 | 1,223 | 531 | 820 | 783 | 379 | 1,006 | 310 | 522 | 861 |
| 1991 | 498 | 520 | 792 | 841 | 807 | 1,119 | 801 | 447 | 1,475 | 574 | 1,020 | 675 |
| 1992 | 850 | 1,167 | 1,383 | 1,925 | 2,049 | 1,219 | 1,852 | 1,785 | 2,191 | 2,020 | 2,187 | 1,868 |
| 1993 | 386 | 560 | 324 | 243 | 176 | 202 | 417 | 294 | 142 | 292 | 101 | 0 |
| 1994 | 1,083 | 535 | 1,670 | 724 | 553 | 416 | 814 | 437 | 435 | 0 | 479 | 706 |
| 1995 | 1,704 | 1,637 | 1,253 | 1,013 | 1,809 | 1,763 | 1,844 | 1,478 | 1,955 | 1,698 | 1,271 | 1,400 |
| 1996 | 1,063 | 1,188 | 1,557 | 1,996 | 2,084 | 1,475 | 1,354 | 1,383 | 885 | 306 | 959 | 1,485 |
| 1997 | 1,733 | 1,505 | 898 | 1,379 | 1,096 | 1,148 | 1,199 | 1,401 | 1,733 | 1,678 | 864 | 1,672 |
| 1998 | 686 | 903 | 1,009 | 1,384 | 1,319 | 1,393 | 1,222 | 2,126 | 1,671 | 1,549 | 1,742 | 1,643 |
| 1999 | 1,138 | 1,306 | 878 | 1,053 | 1,479 | 1,424 | 1,367 | 2,093 | 1,363 | 1,639 | 1,317 | 1,258 |
| 2000 | 1,245 | 540 | 1,201 | 1,362 | 2,090 | 1,814 | 1,763 | 2,037 | 1,454 | 1,024 | 1,412 | 769 |
| 2001 | 2,093 | 1,339 | 729 | 663 | 1,201 | 296 | 593 | 526 | 472 | 324 | 79 | 0 |
| 2002 | 0 | 37 | 0 | 50 | 0 | 648 | 286 | 69 | 105 | 946 | 0 | 605 |
| 2003 | 1,769 | 914 | 1,540 | 1,964 | 2,111 | 1,942 | 1,328 | 2,179 | 1,512 | 1,794 | 1,019 | 1,439 |
| 2004 | 1,688 | 1,406 | 1,506 | 1,024 | 1,522 | 2,066 | 2,469 | 1,706 | 1,964 | 1,627 | 1,143 | 1,238 |
| 2005 | 1,292 | 1,013 | 1,086 | 1,076 | 1,287 | 1,587 | 1,662 | 2,056 | 1,340 | 1,689 | 1,511 | 1,984 |
| 2006 | 1,328 | 256 | 1,504 | 1,045 | 1,520 | 1,800 | 2,002 | 2,036 | 1,226 | 1,355 | 1,453 | 1,238 |
| 2007 | 1,235 | 1,083 | 993 | 1,120 | 1,422 | 2,031 | 1,610 | 1,869 | 934 | 1,140 | 951 | 705 |
| 2008 | 340 | 149 | 523 | 935 | 1,182 | 1,225 | 1,175 | 959 | 1,134 | 512 | 210 | 422 |
| 2009 | 378 | 699 | 343 | 824 | 551 | 332 | 492 | 278 | 116 | 0 | 118 | 115 |
| 2010 | 382 | 532 | 0 | 0 | 254 | 282 | 349 | 360 | 0 | 0 | 0 | 305 |
| 2011 | 45 | 110 | 225 | 539 | 383 | 490 | 147 | 280 | 0 | 0 | 0 | 0 |
| 2012 | 0 | 15 | 108 | 360 | 582 | 474 | 0 | 0 | 0 | 118 | 596 | 0 |
| 2013 | 0 | 0 | 0 | 0 | 0 | 0 | 0 | 0 | 16 | 0 | 360 | 53 |
| 2014 | 197 | 457 | 0 | 0 | 0 | 0 | 0 | 523 | 0 | 0 | 0 | 0 |
| 2015 | 105 | 436 | 0 | 516 | 0 | 530 | 0 | 108 | 118 | 54 | 0 | 100 |
| 2016 | 91 | 401 | 298 | 0 | 0 | 0 | 0 | 0 | 0 | 0 | 0 | 0 |
| 2017 | 0 | 38 | 0 | 165 | 0 | 37 | 37 | 0 | 418 | 0 | 100 | 99 |
| 2018 | 37 | 143 | 94 | 0 | 0 | 0 | 0 | 95 | 0 | 0 | 0 | 105 |
| 2019 | 0 | 0 | 0 | 0 | 0 | 0 | 0 | 0 | 0 | 0 | 0 | 0 |
| 2020 | 0 | 0 | 308 | 480 | 643 | 40 | 107 | 72 | 0 | 143 | 0 | 365 |
| 2021 | 0 | 0 | 0 | 49 | 0 | 0 | 0 | 0 | 228 | 45 | 87 | 27 |
| 2022 | 92 | 80 | 0 | 0 | 35 | 0 | 0 | 93 | 0 | 1 | 0 | 0 |
| 2023 | 0 | 0 | 0 | 0 | 0 | 0 | 0 | 0 | 0 | 0 | 0 | 57 |
| 2024 | 0 | |||||||||||
| - = No Data Reported; -- = Not Applicable; NA = Not Available; W = Withheld to avoid disclosure of individual company data. |
| Release Date: 3/29/2024 |
| Next Release Date: 4/30/2024 |