|
Download Data (XLS File) |
|
||||||||
|
||||||||
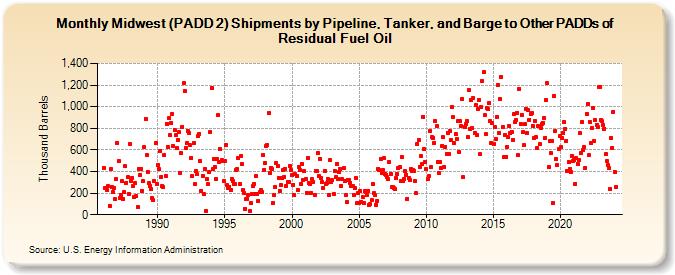
| Midwest (PADD 2) Shipments by Pipeline, Tanker, and Barge to Other PADDs of Residual Fuel Oil (Thousand Barrels) | ||||||||
| Year | Jan | Feb | Mar | Apr | May | Jun | Jul | Aug | Sep | Oct | Nov | Dec |
|---|---|---|---|---|---|---|---|---|---|---|---|---|
| 1986 | 432 | 249 | 248 | 229 | 263 | 85 | 419 | 259 | 209 | 251 | 144 | 329 |
| 1987 | 666 | 497 | 153 | 184 | 309 | 144 | 207 | 447 | 296 | 346 | 194 | 658 |
| 1988 | 316 | 342 | 263 | 163 | 290 | 171 | 71 | 425 | 368 | 424 | 222 | 309 |
| 1989 | 624 | 890 | 553 | 396 | 291 | 269 | 236 | 159 | 134 | 308 | 662 | 286 |
| 1990 | 461 | 419 | 590 | 353 | 266 | 258 | 550 | 357 | 840 | 627 | 893 | 735 |
| 1991 | 853 | 935 | 634 | 781 | 736 | 617 | 696 | 763 | 387 | 568 | 815 | 1,217 |
| 1992 | 1,141 | 619 | 660 | 779 | 757 | 641 | 529 | 354 | 661 | 283 | 405 | 374 |
| 1993 | 726 | 751 | 499 | 222 | 362 | 190 | 426 | 36 | 327 | 283 | 397 | 768 |
| 1994 | 1,175 | 421 | 516 | 440 | 330 | 518 | 920 | 492 | 608 | 508 | 499 | 311 |
| 1995 | 499 | 648 | 271 | 251 | 261 | 228 | 331 | 309 | 283 | 282 | 414 | 420 |
| 1996 | 523 | 283 | 542 | 469 | 230 | 203 | 56 | 143 | 149 | 182 | 33 | 109 |
| 1997 | 192 | 263 | 286 | 195 | 359 | 195 | 129 | 206 | 228 | 208 | 555 | 418 |
| 1998 | 480 | 638 | 647 | 938 | 383 | 436 | 422 | 112 | 187 | 257 | 480 | 448 |
| 1999 | 341 | 220 | 275 | 341 | 411 | 348 | 426 | 269 | 302 | 300 | 451 | 412 |
| 2000 | 364 | 278 | 181 | 373 | 360 | 226 | 443 | 415 | 282 | 471 | 325 | 402 |
| 2001 | 326 | 204 | 527 | 294 | 284 | 204 | 326 | 303 | 182 | 409 | 401 | 573 |
| 2002 | 358 | 517 | 339 | 305 | 251 | 407 | 282 | 295 | 329 | 186 | 502 | 300 |
| 2003 | 319 | 191 | 404 | 345 | 474 | 327 | 393 | 426 | 269 | 326 | 428 | 312 |
| 2004 | 180 | 115 | 324 | 321 | 297 | 264 | 262 | 185 | 249 | 341 | 104 | 205 |
| 2005 | 110 | 219 | 120 | 165 | 113 | 216 | 207 | 181 | 221 | 92 | 96 | 136 |
| 2006 | 282 | 197 | 180 | 93 | 130 | 423 | 418 | 516 | 385 | 411 | 522 | 380 |
| 2007 | 370 | 350 | 329 | 488 | 378 | 253 | 255 | 243 | 234 | 339 | 374 | 428 |
| 2008 | 442 | 312 | 532 | 314 | 335 | 402 | 372 | 148 | 338 | 321 | 424 | 404 |
| 2009 | 416 | 409 | 308 | 198 | 657 | 692 | 444 | 540 | 467 | 908 | 605 | 490 |
| 2010 | 423 | 327 | 357 | 776 | 440 | 715 | 712 | 664 | 865 | 817 | 488 | 388 |
| 2011 | 488 | 434 | 638 | 718 | 445 | 629 | 562 | 761 | 561 | 772 | 695 | 997 |
| 2012 | 901 | 660 | 743 | 704 | 866 | 578 | 863 | 825 | 1,073 | 346 | 812 | 840 |
| 2013 | 863 | 720 | 1,152 | 796 | 1,064 | 800 | 1,080 | 760 | 1,012 | 742 | 975 | 1,065 |
| 2014 | 560 | 997 | 1,236 | 1,317 | 920 | 747 | 987 | 974 | 1,031 | 867 | 664 | 848 |
| 2015 | 656 | 809 | 699 | 908 | 1,200 | 760 | 1,073 | 1,275 | 813 | 534 | 736 | 538 |
| 2016 | 631 | 721 | 818 | 753 | 766 | 695 | 928 | 859 | 875 | 946 | 552 | 1,164 |
| 2017 | 844 | 926 | 762 | 641 | 837 | 981 | 759 | 967 | 881 | 934 | 939 | 822 |
| 2018 | 711 | 869 | 715 | 613 | 821 | 651 | 806 | 842 | 853 | 897 | 712 | 1,062 |
| 2019 | 1,215 | 442 | 679 | 571 | 686 | 110 | 1,103 | 779 | 516 | 458 | 606 | 728 |
| 2020 | 624 | 713 | 759 | 860 | 797 | 685 | 403 | 490 | 423 | 395 | 548 | 497 |
| 2021 | 502 | 287 | 521 | 473 | 509 | 756 | 571 | 860 | 597 | 624 | 437 | 936 |
| 2022 | 1,028 | 550 | 860 | 664 | 805 | 984 | 687 | 874 | 835 | 813 | 1,179 | 1,185 |
| 2023 | 880 | 865 | 832 | 797 | 560 | 495 | 456 | 433 | 239 | 714 | 621 | 955 |
| 2024 | 400 | |||||||||||
| - = No Data Reported; -- = Not Applicable; NA = Not Available; W = Withheld to avoid disclosure of individual company data. |
| Release Date: 3/29/2024 |
| Next Release Date: 4/30/2024 |