|
Download Data (XLS File) |
|
||||||||
|
||||||||
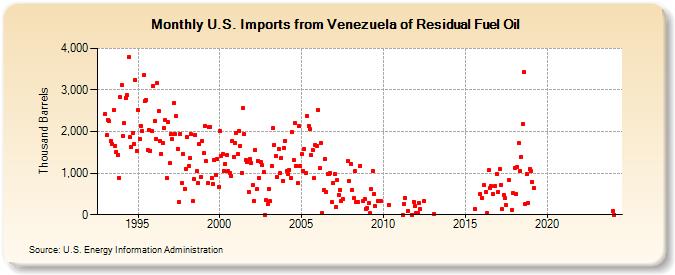
| U.S. Imports from Venezuela of Residual Fuel Oil (Thousand Barrels) | ||||||||
| Year | Jan | Feb | Mar | Apr | May | Jun | Jul | Aug | Sep | Oct | Nov | Dec |
|---|---|---|---|---|---|---|---|---|---|---|---|---|
| 1993 | 2,420 | 1,910 | 2,287 | 2,246 | 1,783 | 1,695 | 2,519 | 1,655 | 1,517 | 1,444 | 887 | 2,830 |
| 1994 | 3,119 | 1,888 | 2,195 | 2,809 | 2,868 | 3,788 | 1,862 | 1,628 | 1,973 | 1,699 | 3,243 | 1,543 |
| 1995 | 2,517 | 1,818 | 2,132 | 2,012 | 3,360 | 2,733 | 2,763 | 1,556 | 2,037 | 1,539 | 2,010 | 3,100 |
| 1996 | 2,252 | 1,824 | 3,164 | 2,491 | 1,782 | 1,470 | 1,727 | 2,088 | 2,272 | 877 | 2,228 | 1,243 |
| 1997 | 1,935 | 1,823 | 2,686 | 1,951 | 2,367 | 1,585 | 311 | 1,953 | 762 | 1,466 | 622 | 1,108 |
| 1998 | 1,858 | 1,165 | 1,352 | 1,930 | 323 | 854 | 1,917 | 1,046 | 758 | 1,691 | 908 | 1,770 |
| 1999 | 1,474 | 2,145 | 1,282 | 756 | 2,101 | 2,117 | 891 | 735 | 1,309 | 965 | 1,338 | 670 |
| 2000 | 2,018 | 1,424 | 1,460 | 1,053 | 1,226 | 1,426 | 1,043 | 995 | 932 | 1,772 | 1,397 | 1,729 |
| 2001 | 1,969 | 1,465 | 2,019 | 1,653 | 1,010 | 2,555 | 1,934 | 1,318 | 1,279 | 556 | 1,334 | 1,249 |
| 2002 | 711 | 334 | 1,557 | 610 | 1,300 | 880 | 1,273 | 1,184 | 1,032 | 0 | 342 | 254 |
| 2003 | 625 | 321 | 1,172 | 2,078 | 1,678 | 1,412 | 904 | 1,579 | 996 | 1,370 | 820 | 1,615 |
| 2004 | 1,781 | 1,046 | 976 | 1,082 | 881 | 1,983 | 1,326 | 2,203 | 1,182 | 755 | 2,129 | 1,181 |
| 2005 | 1,453 | 1,058 | 1,570 | 1,014 | 2,386 | 2,137 | 2,050 | 1,428 | 1,559 | 872 | 1,680 | 1,664 |
| 2006 | 2,528 | 1,114 | 1,728 | 45 | 593 | 1,349 | 544 | 990 | 968 | 1,002 | 299 | 766 |
| 2007 | 971 | 175 | 827 | 486 | 603 | 320 | 368 | 1,293 | 800 | |||
| 2008 | 1,215 | 600 | 393 | 1,043 | 314 | 315 | 1,179 | 330 | 369 | 148 | ||
| 2009 | 163 | 289 | 32 | 607 | 1,055 | 508 | 198 | 321 | 322 | |||
| 2010 | 241 | |||||||||||
| 2011 | 3 | 253 | 408 | 100 | 3 | 313 | 209 | |||||
| 2012 | 48 | 31 | 283 | 139 | 323 | |||||||
| 2013 | 24 | |||||||||||
| 2015 | 131 | 508 | ||||||||||
| 2016 | 409 | 717 | 556 | 32 | 1,066 | 642 | 684 | 506 | 689 | 985 | ||
| 2017 | 550 | 1,090 | 725 | 131 | 478 | 401 | 231 | 825 | 122 | 518 | ||
| 2018 | 1,127 | 509 | 1,155 | 1,723 | 1,040 | 1,389 | 2,188 | 3,432 | 250 | 976 | 288 | 1,100 |
| 2019 | 1,049 | 792 | 647 | |||||||||
| 2024 | 86 | |||||||||||
| - = No Data Reported; -- = Not Applicable; NA = Not Available; W = Withheld to avoid disclosure of individual company data. |
| Release Date: 3/29/2024 |
| Next Release Date: 4/30/2024 |