|
Download Data (XLS File) |
|
||||||||
|
||||||||
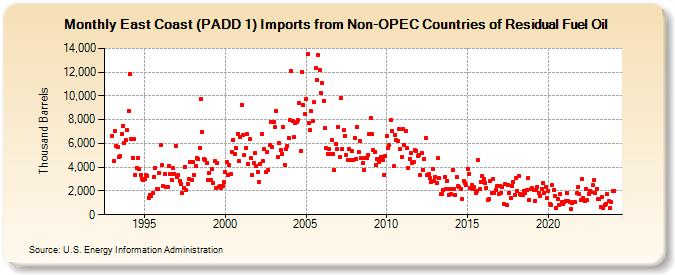
| East Coast (PADD 1) Imports from Non-OPEC Countries of Residual Fuel Oil (Thousand Barrels) | ||||||||
| Year | Jan | Feb | Mar | Apr | May | Jun | Jul | Aug | Sep | Oct | Nov | Dec |
|---|---|---|---|---|---|---|---|---|---|---|---|---|
| 1993 | 6,665 | 4,491 | 7,037 | 5,820 | 5,686 | 4,892 | 4,928 | 6,811 | 7,507 | 6,042 | 6,277 | 7,121 |
| 1994 | 8,737 | 11,813 | 6,409 | 4,807 | 6,391 | 3,364 | 3,922 | 4,799 | 3,808 | 3,336 | 3,048 | 2,943 |
| 1995 | 3,016 | 3,313 | 3,273 | 1,444 | 1,637 | 1,558 | 1,847 | 3,182 | 3,959 | 2,170 | 2,133 | 3,514 |
| 1996 | 5,845 | 4,225 | 2,421 | 3,433 | 2,358 | 2,350 | 4,126 | 3,451 | 2,956 | 3,891 | 3,467 | 5,823 |
| 1997 | 3,138 | 3,325 | 2,871 | 2,588 | 1,825 | 2,260 | 4,058 | 2,060 | 2,589 | 3,036 | 4,453 | 2,943 |
| 1998 | 4,452 | 3,304 | 4,137 | 4,748 | 4,663 | 5,623 | 9,743 | 6,997 | 4,682 | 4,639 | 4,327 | 2,888 |
| 1999 | 3,526 | 2,949 | 3,839 | 2,692 | 4,494 | 2,264 | 4,367 | 2,305 | 2,377 | 2,210 | 2,442 | 2,727 |
| 2000 | 3,591 | 4,430 | 3,311 | 4,152 | 3,428 | 5,307 | 6,269 | 5,124 | 5,611 | 6,815 | 4,506 | 6,556 |
| 2001 | 9,277 | 6,690 | 4,990 | 5,631 | 6,753 | 4,270 | 6,349 | 4,739 | 3,365 | 4,338 | 5,154 | 4,142 |
| 2002 | 3,631 | 2,770 | 4,283 | 6,823 | 4,489 | 5,532 | 3,589 | 5,284 | 3,734 | 5,890 | 7,828 | 5,729 |
| 2003 | 7,820 | 7,369 | 8,697 | 4,817 | 6,048 | 5,446 | 5,151 | 7,354 | 4,196 | 5,560 | 5,817 | 6,473 |
| 2004 | 7,934 | 12,087 | 7,882 | 6,554 | 7,761 | 7,775 | 7,999 | 9,385 | 5,371 | 12,013 | 9,219 | 8,450 |
| 2005 | 9,734 | 13,517 | 7,682 | 7,099 | 8,688 | 7,921 | 9,463 | 12,358 | 11,358 | 13,426 | 12,191 | 10,224 |
| 2006 | 11,069 | 9,596 | 7,324 | 5,624 | 5,131 | 5,518 | 5,089 | 6,324 | 5,119 | 3,743 | 5,989 | 5,505 |
| 2007 | 7,362 | 4,852 | 9,812 | 5,529 | 7,089 | 6,653 | 5,009 | 4,615 | 5,512 | 4,606 | 5,337 | 4,574 |
| 2008 | 6,483 | 4,667 | 7,415 | 5,258 | 6,163 | 4,734 | 4,314 | 3,787 | 4,771 | 4,771 | 5,064 | 6,802 |
| 2009 | 8,141 | 6,757 | 5,472 | 5,316 | 4,163 | 4,673 | 4,418 | 4,687 | 4,860 | 4,591 | 3,378 | 4,939 |
| 2010 | 6,639 | 5,623 | 5,848 | 7,972 | 7,062 | 4,070 | 6,697 | 6,325 | 6,176 | 7,188 | 5,570 | 4,822 |
| 2011 | 7,245 | 5,839 | 7,080 | 5,608 | 3,917 | 4,710 | 5,177 | 4,350 | 4,462 | 5,423 | 5,348 | 4,942 |
| 2012 | 5,049 | 3,341 | 5,216 | 3,805 | 4,701 | 6,482 | 3,319 | 3,385 | 3,077 | 2,754 | 3,857 | 2,798 |
| 2013 | 3,182 | 2,660 | 4,775 | 3,063 | 1,727 | 1,759 | 2,103 | 3,192 | 2,180 | 2,858 | 1,640 | 2,203 |
| 2014 | 1,717 | 3,790 | 2,149 | 1,686 | 3,185 | 2,429 | 2,311 | 2,163 | 1,296 | 2,872 | 2,658 | 2,495 |
| 2015 | 3,886 | 3,460 | 2,277 | 2,469 | 2,133 | 2,346 | 1,854 | 1,956 | 4,571 | 2,206 | 2,712 | 3,224 |
| 2016 | 3,013 | 2,664 | 2,269 | 1,242 | 1,295 | 2,797 | 1,843 | 3,003 | 1,846 | 2,060 | 2,393 | 1,714 |
| 2017 | 2,450 | 1,823 | 2,354 | 943 | 2,617 | 820 | 2,511 | 1,859 | 1,394 | 2,436 | 2,795 | 1,683 |
| 2018 | 3,064 | 2,002 | 3,299 | 1,724 | 1,666 | 1,642 | 1,993 | 1,840 | 2,099 | 3,099 | 1,266 | 2,125 |
| 2019 | 2,208 | 2,094 | 1,155 | 2,103 | 2,334 | 1,791 | 1,604 | 2,157 | 2,705 | 1,813 | 2,362 | 1,394 |
| 2020 | 2,001 | 915 | 837 | 2,517 | 2,082 | 1,534 | 546 | 1,288 | 789 | 1,742 | 1,078 | 942 |
| 2021 | 1,047 | 1,126 | 1,862 | 1,154 | 1,057 | 440 | 991 | 1,093 | 1,084 | 1,790 | 2,307 | 1,737 |
| 2022 | 1,242 | 2,992 | 1,383 | 1,165 | 2,150 | 1,244 | 1,737 | 2,029 | 1,873 | 2,482 | 2,899 | 1,806 |
| 2023 | 2,206 | 1,295 | 1,355 | 668 | 1,524 | 556 | 828 | 919 | 1,741 | 1,131 | 592 | 1,074 |
| 2024 | 1,974 | |||||||||||
| - = No Data Reported; -- = Not Applicable; NA = Not Available; W = Withheld to avoid disclosure of individual company data. |
| Release Date: 3/29/2024 |
| Next Release Date: 4/30/2024 |