|
Download Data (XLS File) |
|
||||||||
|
||||||||
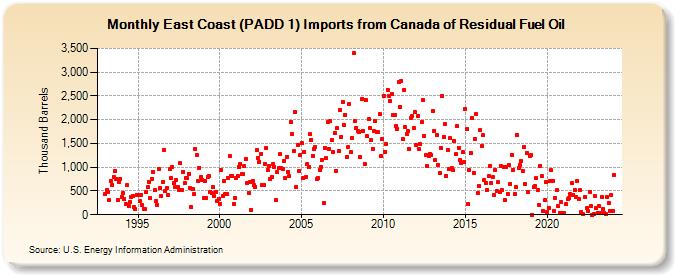
| East Coast (PADD 1) Imports from Canada of Residual Fuel Oil (Thousand Barrels) | ||||||||
| Year | Jan | Feb | Mar | Apr | May | Jun | Jul | Aug | Sep | Oct | Nov | Dec |
|---|---|---|---|---|---|---|---|---|---|---|---|---|
| 1993 | 444 | 520 | 476 | 307 | 706 | 628 | 797 | 915 | 751 | 310 | 688 | 761 |
| 1994 | 371 | 461 | 328 | 219 | 625 | 188 | 275 | 366 | 397 | 165 | 111 | 423 |
| 1995 | 411 | 283 | 419 | 210 | 129 | 112 | 482 | 579 | 695 | 348 | 762 | 909 |
| 1996 | 511 | 279 | 207 | 972 | 557 | 386 | 683 | 1,367 | 504 | 572 | 406 | 955 |
| 1997 | 769 | 1,007 | 664 | 580 | 733 | 582 | 527 | 1,081 | 528 | 906 | 663 | 777 |
| 1998 | 772 | 859 | 552 | 157 | 542 | 433 | 1,385 | 1,264 | 707 | 993 | 787 | 739 |
| 1999 | 361 | 707 | 358 | 789 | 807 | 486 | 467 | 575 | 386 | 476 | 284 | 324 |
| 2000 | 234 | 932 | 397 | 719 | 427 | 442 | 782 | 1,226 | 812 | 820 | 235 | 348 |
| 2001 | 781 | 810 | 994 | 1,076 | 860 | 854 | 1,018 | 1,168 | 672 | 462 | 685 | 103 |
| 2002 | 719 | 629 | 585 | 1,357 | 1,184 | 1,113 | 1,285 | 635 | 617 | 1,076 | 1,414 | 949 |
| 2003 | 1,017 | 754 | 800 | 1,068 | 1,013 | 304 | 898 | 977 | 1,277 | 977 | 958 | 1,140 |
| 2004 | 765 | 1,225 | 899 | 813 | 1,946 | 1,698 | 1,333 | 2,162 | 579 | 1,469 | 929 | 1,265 |
| 2005 | 1,500 | 767 | 1,330 | 790 | 1,059 | 994 | 1,693 | 1,573 | 1,246 | 1,393 | 1,418 | 752 |
| 2006 | 772 | 946 | 1,009 | 1,158 | 256 | 1,412 | 1,185 | 1,950 | 1,392 | 1,966 | 1,562 | 1,319 |
| 2007 | 1,722 | 924 | 1,823 | 1,350 | 2,211 | 1,642 | 2,372 | 1,891 | 2,105 | 1,224 | 1,416 | 2,332 |
| 2008 | 1,318 | 1,614 | 3,401 | 1,965 | 1,825 | 1,763 | 1,750 | 1,213 | 2,444 | 1,762 | 1,077 | 2,424 |
| 2009 | 1,646 | 2,005 | 1,818 | 1,562 | 1,393 | 1,756 | 1,976 | 1,751 | 1,736 | 2,109 | 1,234 | 1,589 |
| 2010 | 2,507 | 1,329 | 1,487 | 2,626 | 2,492 | 2,392 | 2,536 | 2,107 | 2,095 | 1,864 | 1,795 | 2,787 |
| 2011 | 2,266 | 2,818 | 1,590 | 2,632 | 1,839 | 1,709 | 1,754 | 1,374 | 2,042 | 2,072 | 1,819 | 2,153 |
| 2012 | 1,470 | 2,070 | 1,377 | 1,479 | 1,948 | 2,407 | 1,655 | 1,248 | 1,017 | 1,230 | 1,286 | 1,256 |
| 2013 | 2,190 | 1,772 | 1,161 | 1,676 | 1,045 | 881 | 1,404 | 2,504 | 1,643 | 1,905 | 824 | 1,364 |
| 2014 | 959 | 1,605 | 985 | 933 | 1,559 | 1,270 | 1,860 | 1,404 | 1,161 | 1,089 | 1,311 | 1,107 |
| 2015 | 2,229 | 1,796 | 229 | 940 | 1,295 | 2,036 | 878 | 1,602 | 2,122 | 448 | 611 | 1,780 |
| 2016 | 1,449 | 1,669 | 725 | 671 | 521 | 809 | 1,034 | 669 | 786 | 420 | 949 | 498 |
| 2017 | 678 | 474 | 1,027 | 511 | 999 | 316 | 1,000 | 442 | 1,054 | 650 | 1,260 | 941 |
| 2018 | 433 | 580 | 1,683 | 988 | 1,046 | 1,123 | 928 | 1,430 | 641 | 1,302 | 483 | 1,239 |
| 2019 | 1,254 | 4 | 580 | 594 | 765 | 522 | 208 | 1,023 | 807 | 69 | 301 | 695 |
| 2020 | 67 | 147 | 703 | 934 | 699 | 87 | 351 | 511 | 176 | 40 | 270 | 42 |
| 2021 | 45 | 216 | 324 | 360 | 440 | 657 | 415 | 510 | 365 | 700 | 341 | |
| 2022 | 512 | 59 | 8 | 363 | 142 | 81 | 479 | 183 | 4 | 16 | 386 | |
| 2023 | 137 | 39 | 173 | 38 | 377 | 121 | 35 | 14 | 363 | 241 | 82 | 405 |
| 2024 | 87 | |||||||||||
| - = No Data Reported; -- = Not Applicable; NA = Not Available; W = Withheld to avoid disclosure of individual company data. |
| Release Date: 3/29/2024 |
| Next Release Date: 4/30/2024 |