|
Download Data (XLS File) |
|
||||||||
|
||||||||
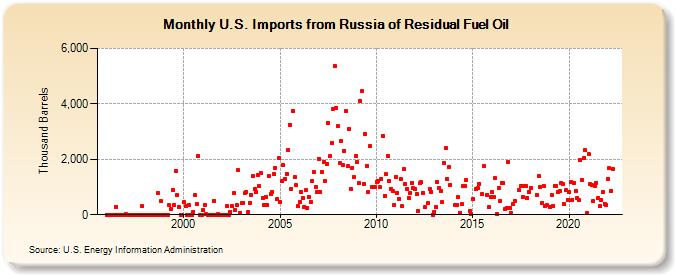
| U.S. Imports from Russia of Residual Fuel Oil (Thousand Barrels) | ||||||||
| Year | Jan | Feb | Mar | Apr | May | Jun | Jul | Aug | Sep | Oct | Nov | Dec |
|---|---|---|---|---|---|---|---|---|---|---|---|---|
| 1996 | 0 | 0 | 0 | 0 | 0 | 0 | 291 | 0 | 0 | 0 | 0 | 0 |
| 1997 | 25 | 0 | 0 | 0 | 0 | 0 | 0 | 0 | 0 | 0 | 322 | 0 |
| 1998 | 0 | 0 | 0 | 0 | 0 | 0 | 0 | 0 | 785 | 0 | 483 | 0 |
| 1999 | 0 | 0 | 0 | 338 | 215 | 891 | 365 | 1,592 | 716 | 285 | 0 | 0 |
| 2000 | 441 | 299 | 0 | 355 | 0 | 0 | 110 | 698 | 386 | 2,130 | 0 | 0 |
| 2001 | 158 | 351 | 16 | 0 | 0 | 0 | 0 | 507 | 0 | 19 | 0 | 0 |
| 2002 | 0 | 0 | 0 | 328 | 0 | 100 | 313 | 767 | 169 | 353 | 1,603 | 79 |
| 2003 | 413 | 423 | 775 | 822 | 89 | 436 | 721 | 1,388 | 927 | 834 | 1,422 | 1,034 |
| 2004 | 1,492 | 609 | 368 | 631 | 340 | 1,397 | 733 | 825 | 1,466 | 1,702 | 566 | 2,038 |
| 2005 | 469 | 1,204 | 1,781 | 1,301 | 1,473 | 2,352 | 3,251 | 944 | 3,759 | 1,360 | 1,058 | 307 |
| 2006 | 460 | 825 | 587 | 282 | 875 | 251 | 654 | 473 | 1,217 | 1,539 | 1,011 | 821 |
| 2007 | 2,027 | 819 | 1,549 | 1,915 | 1,201 | 1,844 | 3,305 | 2,105 | 2,570 | 3,831 | 5,357 | 3,864 |
| 2008 | 3,198 | 1,852 | 2,662 | 1,780 | 2,316 | 3,734 | 1,751 | 3,096 | 934 | 1,702 | 1,345 | 2,103 |
| 2009 | 1,892 | 1,137 | 4,089 | 4,459 | 1,103 | 2,919 | 1,772 | 823 | 2,463 | 1,013 | 983 | 984 |
| 2010 | 1,193 | 1,202 | 985 | 1,289 | 2,841 | 689 | 1,456 | 2,127 | 1,231 | 942 | 846 | 364 |
| 2011 | 1,374 | 782 | 570 | 1,294 | 310 | 1,638 | 1,119 | 942 | 615 | 766 | 1,162 | 947 |
| 2012 | 933 | 754 | 143 | 1,129 | 1,164 | 794 | 268 | 419 | 927 | 831 | 3 | |
| 2013 | 95 | 277 | 1,197 | 981 | 856 | 449 | 1,874 | 2,401 | 1,287 | 1,718 | 1,079 | |
| 2014 | 352 | 357 | 625 | 73 | 375 | 1,034 | 1,034 | 1,259 | 142 | 22 | ||
| 2015 | 566 | 928 | 966 | 1,119 | 731 | 1,746 | 725 | 282 | 623 | |||
| 2016 | 805 | 623 | 1,313 | 19 | 973 | 502 | 1,156 | 1,135 | 202 | 234 | 1,916 | 259 |
| 2017 | 49 | 379 | 491 | 881 | 1,019 | 637 | 1,030 | 1,033 | 611 | 825 | ||
| 2018 | 967 | 729 | 1,386 | 987 | 428 | 1,040 | 301 | 342 | ||||
| 2019 | 278 | 719 | 325 | 1,052 | 1,037 | 822 | 849 | 1,143 | 1,093 | 394 | 878 | 541 |
| 2020 | 823 | 1,194 | 539 | 1,138 | 872 | 595 | 514 | 1,962 | 1,263 | 2,037 | 2,319 | 65 |
| 2021 | 2,194 | 1,101 | 1,078 | 478 | 1,048 | 1,162 | 602 | 299 | 527 | 815 | 399 | 364 |
| 2022 | 1,279 | 1,687 | 861 | 1,658 | ||||||||
| - = No Data Reported; -- = Not Applicable; NA = Not Available; W = Withheld to avoid disclosure of individual company data. |
| Release Date: 3/29/2024 |
| Next Release Date: 4/30/2024 |