|
Download Data (XLS File) |
|
||||||||
|
||||||||
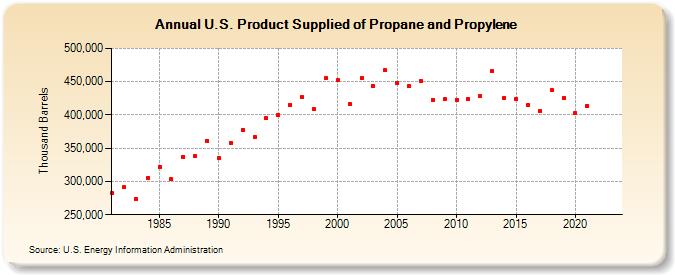
| U.S. Product Supplied of Propane and Propylene (Thousand Barrels) | ||||||||
| Decade | Year-0 | Year-1 | Year-2 | Year-3 | Year-4 | Year-5 | Year-6 | Year-7 | Year-8 | Year-9 |
|---|---|---|---|---|---|---|---|---|---|---|
| 1980's | 282,098 | 291,126 | 273,950 | 305,001 | 322,139 | 303,177 | 337,300 | 337,747 | 361,456 | |
| 1990's | 334,677 | 358,257 | 377,824 | 367,206 | 394,948 | 399,882 | 415,627 | 427,005 | 408,691 | 454,819 |
| 2000's | 451,940 | 416,659 | 455,508 | 443,342 | 466,983 | 448,685 | 443,415 | 450,726 | 422,439 | 423,421 |
| 2010's | 422,325 | 423,941 | 428,394 | 465,293 | 426,031 | 423,422 | 415,220 | 405,669 | 437,650 | 425,759 |
| 2020's | 403,133 | 413,946 | -- | -- |
| - = No Data Reported; -- = Not Applicable; NA = Not Available; W = Withheld to avoid disclosure of individual company data. |
| Release Date: 3/29/2024 |
| Next Release Date: 8/30/2024 |