|
Download Data (XLS File) |
|
||||||||
|
||||||||
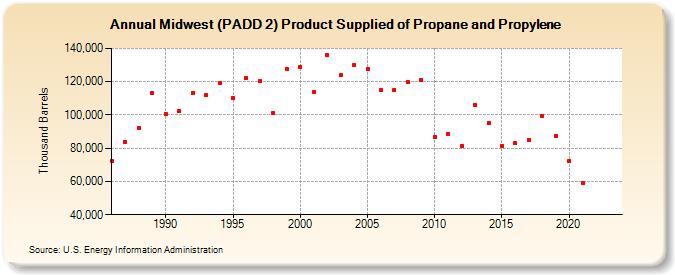
| Midwest (PADD 2) Product Supplied of Propane and Propylene (Thousand Barrels) | ||||||||
| Decade | Year-0 | Year-1 | Year-2 | Year-3 | Year-4 | Year-5 | Year-6 | Year-7 | Year-8 | Year-9 |
|---|---|---|---|---|---|---|---|---|---|---|
| 1980's | 72,095 | 83,653 | 92,206 | 113,306 | ||||||
| 1990's | 100,444 | 102,288 | 113,415 | 111,974 | 119,133 | 110,294 | 122,255 | 120,262 | 101,111 | 127,570 |
| 2000's | 128,606 | 113,996 | 136,006 | 123,786 | 130,085 | 127,719 | 114,733 | 115,034 | 119,589 | 121,128 |
| 2010's | 86,785 | 88,619 | 81,270 | 105,767 | 94,916 | 81,492 | 82,894 | 84,770 | 99,583 | 87,590 |
| 2020's | 72,555 | 58,788 | -- | -- |
| - = No Data Reported; -- = Not Applicable; NA = Not Available; W = Withheld to avoid disclosure of individual company data. |
| Release Date: 3/29/2024 |
| Next Release Date: 8/30/2024 |