|
Download Data (XLS File) |
|
||||||||
|
||||||||
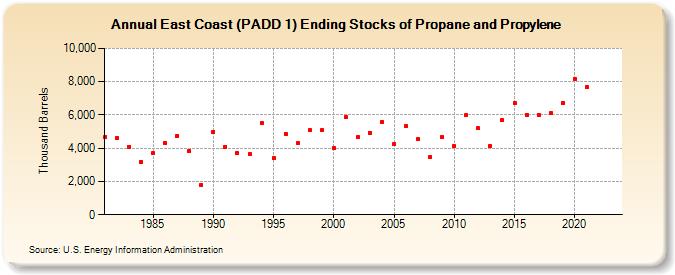
| East Coast (PADD 1) Ending Stocks of Propane and Propylene (Thousand Barrels) | ||||||||
| Decade | Year-0 | Year-1 | Year-2 | Year-3 | Year-4 | Year-5 | Year-6 | Year-7 | Year-8 | Year-9 |
|---|---|---|---|---|---|---|---|---|---|---|
| 1980's | 4,679 | 4,605 | 4,095 | 3,199 | 3,692 | 4,321 | 4,754 | 3,847 | 1,789 | |
| 1990's | 4,990 | 4,093 | 3,693 | 3,650 | 5,528 | 3,398 | 4,878 | 4,305 | 5,069 | 5,072 |
| 2000's | 4,003 | 5,875 | 4,650 | 4,933 | 5,594 | 4,276 | 5,319 | 4,550 | 3,462 | 4,681 |
| 2010's | 4,128 | 5,977 | 5,184 | 4,114 | 5,707 | 6,723 | 6,014 | 5,999 | 6,108 | 6,719 |
| 2020's | 8,182 | 7,666 | -- | -- |
| - = No Data Reported; -- = Not Applicable; NA = Not Available; W = Withheld to avoid disclosure of individual company data. |
| Release Date: 3/29/2024 |
| Next Release Date: 8/30/2024 |