|
Download Data (XLS File) |
|
||||||||
|
||||||||
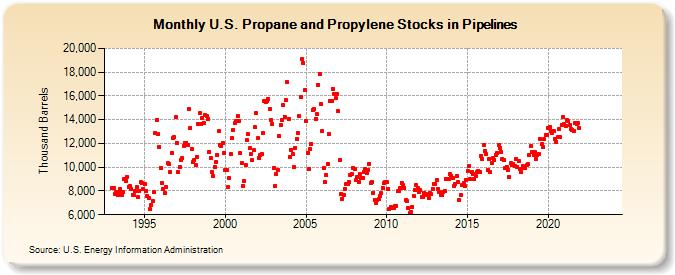
| U.S. Propane and Propylene Stocks in Pipelines (Thousand Barrels) | ||||||||
| Year | Jan | Feb | Mar | Apr | May | Jun | Jul | Aug | Sep | Oct | Nov | Dec |
|---|---|---|---|---|---|---|---|---|---|---|---|---|
| 1993 | 8,280 | 8,243 | 7,762 | 7,926 | 7,672 | 7,921 | 8,194 | 7,684 | 7,874 | 8,971 | 8,870 | 9,216 |
| 1994 | 8,365 | 8,413 | 8,195 | 7,691 | 7,686 | 7,960 | 8,320 | 7,455 | 8,024 | 8,719 | 8,703 | 8,202 |
| 1995 | 8,596 | 7,998 | 7,604 | 7,367 | 6,470 | 6,824 | 7,158 | 7,890 | 12,902 | 13,973 | 12,824 | 11,716 |
| 1996 | 9,957 | 8,679 | 8,132 | 7,807 | 8,372 | 10,319 | 10,249 | 9,606 | 11,236 | 12,455 | 12,513 | 14,210 |
| 1997 | 12,075 | 9,577 | 10,010 | 10,638 | 10,749 | 11,815 | 12,075 | 12,070 | 11,897 | 14,879 | 13,327 | 11,511 |
| 1998 | 10,407 | 10,585 | 10,184 | 10,900 | 13,625 | 14,535 | 13,615 | 14,136 | 13,756 | 14,359 | 14,287 | 14,041 |
| 1999 | 11,318 | 10,773 | 9,560 | 9,233 | 9,998 | 10,452 | 11,060 | 13,017 | 11,879 | 11,775 | 12,063 | 11,226 |
| 2000 | 9,761 | 9,777 | 8,316 | 9,057 | 11,118 | 12,451 | 13,128 | 13,756 | 13,889 | 14,327 | 13,853 | 11,156 |
| 2001 | 10,363 | 8,457 | 8,816 | 10,191 | 12,265 | 12,809 | 11,603 | 11,069 | 10,564 | 11,444 | 13,346 | 14,533 |
| 2002 | 12,433 | 10,775 | 11,013 | 11,096 | 12,839 | 15,551 | 15,481 | 15,550 | 15,749 | 14,909 | 13,972 | 13,655 |
| 2003 | 9,960 | 8,446 | 9,420 | 9,737 | 12,610 | 13,560 | 13,997 | 15,230 | 14,267 | 15,643 | 17,165 | 14,040 |
| 2004 | 10,897 | 11,477 | 11,103 | 9,980 | 11,617 | 12,358 | 12,884 | 14,286 | 15,894 | 19,077 | 18,764 | 16,493 |
| 2005 | 13,868 | 11,211 | 9,828 | 11,492 | 11,937 | 14,811 | 14,875 | 14,085 | 14,456 | 16,937 | 17,828 | 15,313 |
| 2006 | 13,030 | 9,937 | 8,751 | 9,355 | 10,253 | 12,796 | 15,573 | 15,545 | 16,621 | 16,197 | 15,785 | 16,171 |
| 2007 | 14,691 | 10,610 | 7,781 | 7,341 | 7,619 | 8,201 | 8,583 | 8,624 | 8,726 | 9,305 | 9,423 | 9,937 |
| 2008 | 9,821 | 8,898 | 9,152 | 8,760 | 9,391 | 9,127 | 9,131 | 9,577 | 9,819 | 9,528 | 9,757 | 10,302 |
| 2009 | 8,694 | 8,743 | 7,860 | 7,259 | 6,992 | 7,221 | 7,304 | 7,535 | 7,802 | 8,250 | 8,639 | 8,761 |
| 2010 | 8,750 | 8,151 | 6,507 | 6,652 | 6,571 | 6,588 | 6,697 | 6,754 | 7,957 | 7,976 | 8,224 | 8,694 |
| 2011 | 8,489 | 8,271 | 7,198 | 7,125 | 6,544 | 6,104 | 6,251 | 6,659 | 7,615 | 8,083 | 8,498 | 8,237 |
| 2012 | 7,936 | 8,072 | 7,480 | 7,512 | 7,828 | 7,719 | 7,651 | 7,382 | 7,826 | 7,737 | 8,205 | 8,619 |
| 2013 | 8,589 | 8,939 | 8,203 | 7,878 | 7,665 | 7,644 | 7,929 | 8,004 | 9,017 | 9,033 | 9,028 | 9,389 |
| 2014 | 9,287 | 9,056 | 8,398 | 8,609 | 9,270 | 8,750 | 7,232 | 7,683 | 8,488 | 8,645 | 8,408 | 8,946 |
| 2015 | 9,664 | 10,108 | 8,981 | 9,616 | 9,417 | 9,025 | 9,229 | 9,618 | 9,715 | 9,583 | 10,951 | 10,675 |
| 2016 | 11,851 | 11,389 | 11,083 | 9,783 | 10,651 | 9,595 | 10,342 | 10,754 | 10,603 | 11,032 | 11,194 | 11,853 |
| 2017 | 11,629 | 11,275 | 10,706 | 10,628 | 9,906 | 10,052 | 9,782 | 9,170 | 10,326 | 10,145 | 10,261 | 10,131 |
| 2018 | 10,672 | 10,027 | 10,530 | 9,809 | 9,559 | 10,092 | 9,954 | 9,907 | 10,143 | 10,227 | 11,028 | 11,765 |
| 2019 | 11,248 | 11,063 | 11,237 | 10,728 | 10,991 | 11,142 | 12,343 | 11,911 | 11,686 | 12,332 | 12,686 | 12,717 |
| 2020 | 13,320 | 13,383 | 13,052 | 12,884 | 13,054 | 12,397 | 12,146 | 12,508 | 13,199 | 12,518 | 13,557 | 14,234 |
| 2021 | 13,609 | 13,508 | 14,002 | 13,898 | 13,591 | 13,234 | 13,164 | 13,076 | 13,729 | 13,625 | 13,699 | 13,339 |
| 2022 | -- | -- | -- | -- | -- | -- | -- | -- | -- | -- | -- | -- |
| 2023 | -- | -- | -- | -- | -- | -- | -- | -- | -- | -- | -- | -- |
| 2024 | -- | |||||||||||
| - = No Data Reported; -- = Not Applicable; NA = Not Available; W = Withheld to avoid disclosure of individual company data. |
| Release Date: 3/29/2024 |
| Next Release Date: 4/30/2024 |