|
Download Data (XLS File) |
|
||||||||
|
||||||||
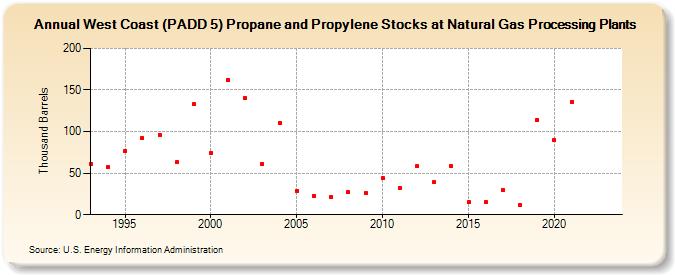
| West Coast (PADD 5) Propane and Propylene Stocks at Natural Gas Processing Plants (Thousand Barrels) | ||||||||
| Decade | Year-0 | Year-1 | Year-2 | Year-3 | Year-4 | Year-5 | Year-6 | Year-7 | Year-8 | Year-9 |
|---|---|---|---|---|---|---|---|---|---|---|
| 1990's | 61 | 57 | 77 | 92 | 96 | 63 | 133 | |||
| 2000's | 74 | 162 | 140 | 61 | 110 | 29 | 23 | 21 | 27 | 26 |
| 2010's | 44 | 32 | 58 | 39 | 58 | 15 | 15 | 30 | 12 | 114 |
| 2020's | 90 | 136 | -- | -- |
| - = No Data Reported; -- = Not Applicable; NA = Not Available; W = Withheld to avoid disclosure of individual company data. |
| Release Date: 8/30/2024 |
| Next Release Date: 8/29/2025 |