|
Download Data (XLS File) |
|
||||||||
|
||||||||
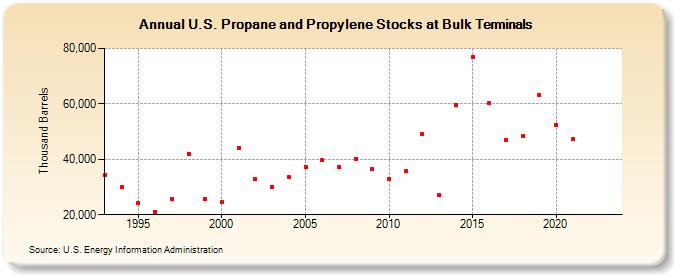
| U.S. Propane and Propylene Stocks at Bulk Terminals (Thousand Barrels) | ||||||||
| Decade | Year-0 | Year-1 | Year-2 | Year-3 | Year-4 | Year-5 | Year-6 | Year-7 | Year-8 | Year-9 |
|---|---|---|---|---|---|---|---|---|---|---|
| 1990's | 34,405 | 29,967 | 24,324 | 21,079 | 25,836 | 42,037 | 25,655 | |||
| 2000's | 24,614 | 44,244 | 32,721 | 30,176 | 33,608 | 37,312 | 39,562 | 37,086 | 40,238 | 36,473 |
| 2010's | 32,884 | 35,920 | 49,201 | 27,035 | 59,437 | 76,878 | 60,179 | 47,104 | 48,216 | 63,043 |
| 2020's | 52,535 | 47,206 | -- | -- |
| - = No Data Reported; -- = Not Applicable; NA = Not Available; W = Withheld to avoid disclosure of individual company data. |
| Release Date: 3/29/2024 |
| Next Release Date: 8/30/2024 |