|
Download Data (XLS File) |
|
||||||||
|
||||||||
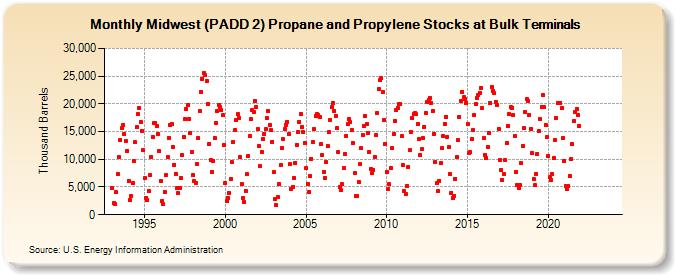
| Midwest (PADD 2) Propane and Propylene Stocks at Bulk Terminals (Thousand Barrels) | ||||||||
| Year | Jan | Feb | Mar | Apr | May | Jun | Jul | Aug | Sep | Oct | Nov | Dec |
|---|---|---|---|---|---|---|---|---|---|---|---|---|
| 1993 | 4,749 | 2,091 | 1,978 | 4,088 | 7,316 | 10,369 | 13,557 | 15,616 | 16,241 | 14,612 | 13,289 | 11,525 |
| 1994 | 6,165 | 2,672 | 3,386 | 5,667 | 9,612 | 13,068 | 15,810 | 18,184 | 19,279 | 16,749 | 15,151 | 11,588 |
| 1995 | 6,604 | 3,102 | 2,691 | 4,302 | 7,116 | 10,417 | 13,979 | 16,518 | 16,535 | 16,075 | 14,562 | 11,451 |
| 1996 | 5,993 | 2,474 | 1,887 | 4,125 | 7,110 | 10,370 | 13,857 | 16,159 | 16,298 | 12,241 | 9,045 | 7,411 |
| 1997 | 4,768 | 3,838 | 4,775 | 6,592 | 10,728 | 14,094 | 17,178 | 19,096 | 19,787 | 17,352 | 14,747 | 11,318 |
| 1998 | 7,079 | 6,005 | 5,806 | 9,187 | 13,855 | 18,645 | 22,215 | 24,566 | 25,568 | 25,165 | 24,142 | 20,049 |
| 1999 | 12,827 | 9,957 | 7,747 | 9,715 | 13,795 | 16,632 | 18,648 | 19,804 | 19,392 | 18,822 | 17,904 | 12,618 |
| 2000 | 5,754 | 2,507 | 3,037 | 3,879 | 6,388 | 9,454 | 13,079 | 15,210 | 17,001 | 18,207 | 17,511 | 10,416 |
| 2001 | 5,601 | 3,010 | 2,268 | 4,330 | 7,289 | 10,540 | 14,261 | 17,203 | 18,847 | 18,486 | 20,480 | 19,361 |
| 2002 | 15,421 | 12,313 | 8,722 | 11,353 | 13,724 | 14,600 | 15,407 | 17,360 | 18,646 | 16,112 | 15,267 | 13,194 |
| 2003 | 7,656 | 2,912 | 1,699 | 3,140 | 5,502 | 8,899 | 12,031 | 13,578 | 15,456 | 16,234 | 16,778 | 14,523 |
| 2004 | 9,083 | 4,605 | 4,925 | 6,685 | 9,337 | 12,578 | 14,956 | 16,753 | 18,167 | 15,839 | 14,866 | 12,986 |
| 2005 | 8,348 | 5,620 | 4,060 | 6,971 | 10,110 | 13,031 | 15,419 | 17,739 | 18,152 | 17,960 | 17,674 | 12,671 |
| 2006 | 10,792 | 7,773 | 6,701 | 9,477 | 12,353 | 14,854 | 17,081 | 19,381 | 20,112 | 18,749 | 17,842 | 15,578 |
| 2007 | 11,230 | 5,011 | 4,405 | 5,479 | 8,369 | 11,021 | 14,227 | 16,334 | 17,177 | 16,638 | 15,283 | 12,955 |
| 2008 | 7,440 | 3,420 | 3,367 | 5,905 | 9,087 | 11,988 | 14,299 | 15,998 | 17,761 | 16,288 | 14,811 | 11,280 |
| 2009 | 8,229 | 7,435 | 8,069 | 10,367 | 14,388 | 18,420 | 22,607 | 24,283 | 24,584 | 22,104 | 17,094 | 12,835 |
| 2010 | 7,788 | 4,593 | 5,463 | 8,471 | 11,983 | 14,518 | 16,957 | 18,874 | 19,228 | 19,921 | 19,910 | 14,154 |
| 2011 | 8,895 | 4,211 | 3,723 | 5,245 | 8,558 | 11,607 | 15,001 | 17,398 | 18,107 | 18,369 | 18,092 | 16,371 |
| 2012 | 13,599 | 10,734 | 11,807 | 13,834 | 15,874 | 18,315 | 20,271 | 20,771 | 21,086 | 20,163 | 18,669 | 14,620 |
| 2013 | 9,532 | 5,641 | 4,208 | 6,160 | 9,261 | 12,011 | 14,174 | 16,434 | 17,675 | 14,069 | 12,143 | 7,307 |
| 2014 | 4,002 | 3,077 | 3,427 | 6,478 | 10,352 | 13,485 | 17,672 | 20,530 | 22,210 | 21,150 | 20,872 | 20,091 |
| 2015 | 16,332 | 11,213 | 11,233 | 13,573 | 15,304 | 17,983 | 20,049 | 21,039 | 21,613 | 22,035 | 22,902 | 19,180 |
| 2016 | 13,777 | 10,760 | 10,254 | 12,254 | 14,742 | 20,140 | 22,976 | 22,325 | 21,898 | 20,374 | 19,830 | 15,502 |
| 2017 | 9,917 | 8,032 | 6,319 | 7,340 | 9,804 | 12,911 | 15,957 | 18,114 | 19,427 | 19,318 | 17,949 | 14,180 |
| 2018 | 7,637 | 5,315 | 4,832 | 5,298 | 9,319 | 12,420 | 15,614 | 18,496 | 20,787 | 20,597 | 18,016 | 15,538 |
| 2019 | 11,164 | 6,459 | 5,310 | 7,395 | 11,012 | 15,107 | 17,182 | 19,365 | 21,535 | 19,423 | 16,185 | 14,037 |
| 2020 | 10,658 | 6,719 | 6,230 | 7,317 | 10,268 | 13,434 | 17,482 | 20,139 | 20,173 | 20,197 | 19,208 | 13,861 |
| 2021 | 9,689 | 5,101 | 4,717 | 5,163 | 6,984 | 9,993 | 12,792 | 16,858 | 18,575 | 19,086 | 17,896 | 15,972 |
| 2022 | -- | -- | -- | -- | -- | -- | -- | -- | -- | -- | -- | -- |
| 2023 | -- | -- | -- | -- | -- | -- | -- | -- | -- | -- | -- | -- |
| 2024 | -- | |||||||||||
| - = No Data Reported; -- = Not Applicable; NA = Not Available; W = Withheld to avoid disclosure of individual company data. |
| Release Date: 3/29/2024 |
| Next Release Date: 4/30/2024 |