|
Download Data (XLS File) |
|
||||||||
|
||||||||
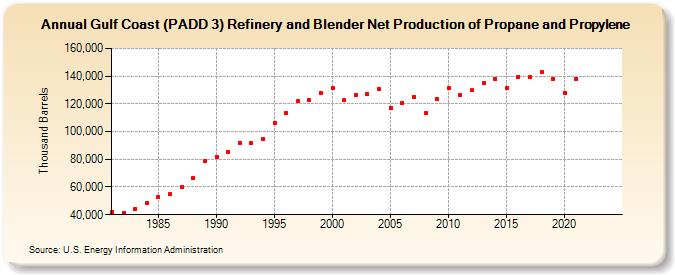
| Gulf Coast (PADD 3) Refinery and Blender Net Production of Propane and Propylene (Thousand Barrels) | ||||||||
| Decade | Year-0 | Year-1 | Year-2 | Year-3 | Year-4 | Year-5 | Year-6 | Year-7 | Year-8 | Year-9 |
|---|---|---|---|---|---|---|---|---|---|---|
| 1980's | 41,872 | 41,291 | 44,186 | 48,118 | 52,872 | 54,611 | 59,939 | 66,652 | 78,719 | |
| 1990's | 81,903 | 85,364 | 91,822 | 91,549 | 94,940 | 106,412 | 113,510 | 121,796 | 122,433 | 127,572 |
| 2000's | 131,260 | 122,699 | 126,672 | 127,343 | 130,757 | 117,100 | 120,442 | 125,195 | 113,374 | 123,261 |
| 2010's | 131,462 | 126,540 | 129,707 | 134,759 | 137,887 | 131,618 | 139,550 | 139,222 | 142,899 | 137,979 |
| 2020's | 128,045 | 137,991 | -- | -- |
| - = No Data Reported; -- = Not Applicable; NA = Not Available; W = Withheld to avoid disclosure of individual company data. |
| Release Date: 3/29/2024 |
| Next Release Date: 8/30/2024 |