|
Download Data (XLS File) |
|
||||||||
|
||||||||
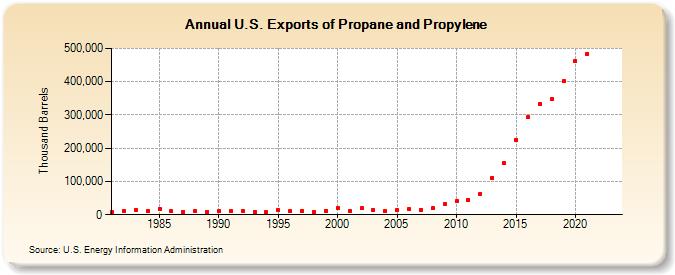
| U.S. Exports of Propane and Propylene (Thousand Barrels) | ||||||||
| Decade | Year-0 | Year-1 | Year-2 | Year-3 | Year-4 | Year-5 | Year-6 | Year-7 | Year-8 | Year-9 |
|---|---|---|---|---|---|---|---|---|---|---|
| 1980's | 6,717 | 11,455 | 15,588 | 10,911 | 17,516 | 10,325 | 8,917 | 11,307 | 8,676 | |
| 1990's | 10,182 | 10,105 | 12,005 | 9,648 | 8,786 | 13,709 | 10,220 | 11,861 | 9,051 | 11,984 |
| 2000's | 19,489 | 11,395 | 20,008 | 13,683 | 10,343 | 13,683 | 16,500 | 15,501 | 19,264 | 30,925 |
| 2010's | 39,860 | 45,243 | 62,490 | 110,163 | 154,331 | 224,426 | 292,499 | 333,544 | 346,495 | 400,670 |
| 2020's | 461,769 | 484,252 | -- | -- |
| - = No Data Reported; -- = Not Applicable; NA = Not Available; W = Withheld to avoid disclosure of individual company data. |
| Release Date: 4/30/2024 |
| Next Release Date: 8/30/2024 |