|
Download Data (XLS File) |
|
||||||||
|
||||||||
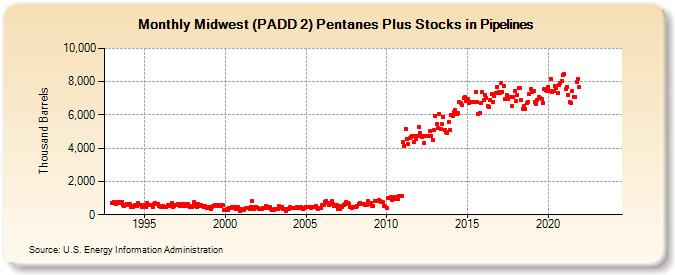
| Midwest (PADD 2) Pentanes Plus Stocks in Pipelines (Thousand Barrels) | ||||||||
| Year | Jan | Feb | Mar | Apr | May | Jun | Jul | Aug | Sep | Oct | Nov | Dec |
|---|---|---|---|---|---|---|---|---|---|---|---|---|
| 1993 | 716 | 787 | 695 | 620 | 779 | 780 | 729 | 787 | 609 | 502 | 609 | 668 |
| 1994 | 605 | 623 | 484 | 489 | 533 | 603 | 550 | 685 | 603 | 591 | 484 | 501 |
| 1995 | 607 | 482 | 724 | 561 | 590 | 571 | 481 | 624 | 726 | 621 | 649 | 510 |
| 1996 | 475 | 437 | 534 | 492 | 493 | 581 | 606 | 534 | 711 | 491 | 541 | 558 |
| 1997 | 578 | 654 | 540 | 519 | 627 | 653 | 513 | 560 | 656 | 551 | 457 | 478 |
| 1998 | 511 | 756 | 641 | 462 | 620 | 540 | 557 | 532 | 444 | 518 | 402 | 428 |
| 1999 | 463 | 366 | 489 | 532 | 569 | 603 | 552 | 599 | 516 | 494 | 586 | 297 |
| 2000 | 279 | 316 | 299 | 388 | 431 | 478 | 418 | 485 | 351 | 436 | 344 | 234 |
| 2001 | 360 | 260 | 293 | 374 | 397 | 427 | 321 | 465 | 805 | 360 | 469 | 489 |
| 2002 | 428 | 353 | 369 | 314 | 416 | 378 | 500 | 449 | 401 | 452 | 322 | 260 |
| 2003 | 284 | 342 | 333 | 333 | 511 | 424 | 455 | 355 | 319 | 252 | 367 | 315 |
| 2004 | 435 | 400 | 420 | 428 | 407 | 463 | 412 | 383 | 467 | 379 | 354 | 414 |
| 2005 | 458 | 473 | 472 | 468 | 427 | 473 | 463 | 505 | 395 | 337 | 387 | 396 |
| 2006 | 564 | 596 | 784 | 843 | 718 | 597 | 699 | 800 | 631 | 535 | 514 | 589 |
| 2007 | 329 | 360 | 507 | 465 | 603 | 633 | 772 | 696 | 672 | 446 | 430 | 491 |
| 2008 | 447 | 463 | 525 | 660 | 715 | 624 | 633 | 617 | 587 | 576 | 809 | 618 |
| 2009 | 679 | 495 | 537 | 837 | 826 | 806 | 862 | 830 | 758 | 765 | 554 | 504 |
| 2010 | 397 | 1,027 | 1,033 | 1,048 | 872 | 970 | 1,075 | 948 | 935 | 1,115 | 1,118 | 1,130 |
| 2011 | 4,360 | 4,139 | 5,178 | 4,574 | 4,226 | 4,608 | 4,685 | 4,735 | 4,367 | 4,723 | 4,548 | 4,740 |
| 2012 | 5,287 | 4,885 | 4,666 | 4,725 | 4,299 | 4,740 | 4,751 | 4,709 | 5,049 | 4,762 | 4,513 | 5,100 |
| 2013 | 5,941 | 5,465 | 5,213 | 6,083 | 5,133 | 5,466 | 5,868 | 5,099 | 4,993 | 4,886 | 5,577 | 5,097 |
| 2014 | 5,975 | 5,930 | 6,149 | 6,299 | 6,079 | 6,101 | 6,761 | 6,714 | 6,590 | 7,004 | 7,101 | 6,858 |
| 2015 | 6,931 | 6,728 | 6,765 | 6,754 | 6,783 | 6,761 | 7,390 | 6,763 | 6,083 | 6,104 | 6,701 | 7,400 |
| 2016 | 6,876 | 7,186 | 7,020 | 6,548 | 6,503 | 6,884 | 7,255 | 6,789 | 7,125 | 7,326 | 7,697 | 7,383 |
| 2017 | 7,300 | 7,892 | 7,393 | 7,730 | 6,962 | 7,216 | 6,982 | 7,078 | 7,087 | 6,538 | 7,055 | 7,410 |
| 2018 | 6,837 | 7,178 | 7,603 | 7,636 | 6,896 | 6,373 | 6,524 | 6,374 | 6,713 | 6,804 | 7,246 | 7,580 |
| 2019 | 7,405 | 7,416 | 6,758 | 6,677 | 6,907 | 7,051 | 6,989 | 6,984 | 6,714 | 7,530 | 7,478 | 7,456 |
| 2020 | 7,691 | 7,457 | 8,182 | 7,388 | 7,433 | 7,759 | 7,595 | 7,293 | 7,786 | 7,933 | 8,047 | 8,419 |
| 2021 | 8,446 | 7,580 | 7,668 | 7,199 | 6,747 | 6,695 | 7,425 | 7,096 | 7,052 | 7,980 | 8,150 | 7,693 |
| 2022 | -- | -- | -- | -- | -- | -- | -- | -- | -- | -- | -- | -- |
| 2023 | -- | -- | -- | -- | -- | -- | -- | -- | -- | -- | -- | -- |
| 2024 | -- | |||||||||||
| - = No Data Reported; -- = Not Applicable; NA = Not Available; W = Withheld to avoid disclosure of individual company data. |
| Release Date: 3/29/2024 |
| Next Release Date: 4/30/2024 |