|
Download Data (XLS File) |
|
||||||||
|
||||||||
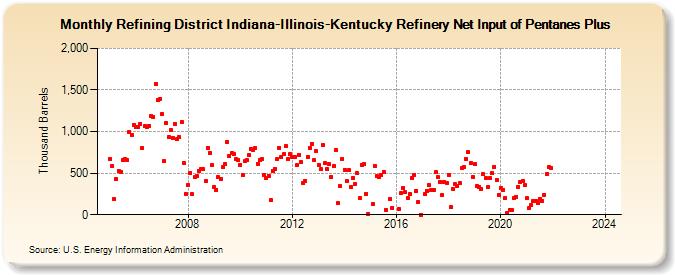
| Refining District Indiana-Illinois-Kentucky Refinery Net Input of Pentanes Plus (Thousand Barrels) | ||||||||
| Year | Jan | Feb | Mar | Apr | May | Jun | Jul | Aug | Sep | Oct | Nov | Dec |
|---|---|---|---|---|---|---|---|---|---|---|---|---|
| 2005 | 672 | 589 | 190 | 432 | 529 | 518 | 663 | 668 | 655 | 993 | 959 | 1,084 |
| 2006 | 1,049 | 1,054 | 1,096 | 805 | 1,068 | 1,054 | 1,071 | 1,187 | 1,176 | 1,576 | 1,378 | 1,395 |
| 2007 | 1,217 | 647 | 1,103 | 934 | 1,016 | 925 | 1,096 | 916 | 933 | 1,116 | 627 | 252 |
| 2008 | 360 | 501 | 246 | 452 | 468 | 530 | 549 | 546 | 402 | 806 | 747 | 593 |
| 2009 | 333 | 303 | 448 | 431 | 569 | 609 | 880 | 710 | 742 | 732 | 669 | 653 |
| 2010 | 596 | 482 | 642 | 655 | 714 | 788 | 782 | 802 | 613 | 660 | 665 | 473 |
| 2011 | 436 | 471 | 173 | 523 | 544 | 669 | 807 | 697 | 727 | 826 | 670 | 726 |
| 2012 | 689 | 690 | 593 | 723 | 632 | 378 | 407 | 698 | 807 | 854 | 655 | 765 |
| 2013 | 601 | 546 | 839 | 622 | 549 | 608 | 456 | 585 | 777 | 139 | 342 | 673 |
| 2014 | 541 | 406 | 532 | 335 | 439 | 370 | 496 | 197 | 601 | 605 | 255 | 12 |
| 2015 | 130 | 586 | 461 | 449 | 474 | 517 | 61 | 192 | 86 | |||
| 2016 | 73 | 256 | 327 | 269 | 200 | 248 | 446 | 483 | 289 | 153 | 1 | |
| 2017 | 251 | 291 | 354 | 302 | 295 | 509 | 448 | 399 | 239 | 393 | 383 | |
| 2018 | 481 | 87 | 311 | 368 | 349 | 376 | 562 | 571 | 671 | 752 | 616 | 452 |
| 2019 | 607 | 344 | 334 | 312 | 485 | 444 | 335 | 438 | 497 | 578 | 422 | 243 |
| 2020 | 324 | 302 | 203 | 17 | 60 | 54 | 203 | 218 | 339 | 394 | 401 | 357 |
| 2021 | 197 | 75 | 115 | 160 | 168 | 136 | 194 | 168 | 242 | 491 | 575 | 567 |
| 2022 | -- | -- | -- | -- | -- | -- | -- | -- | -- | -- | -- | -- |
| 2023 | -- | -- | -- | -- | -- | -- | -- | -- | -- | -- | -- | -- |
| 2024 | -- | |||||||||||
| - = No Data Reported; -- = Not Applicable; NA = Not Available; W = Withheld to avoid disclosure of individual company data. |
| Release Date: 3/29/2024 |
| Next Release Date: 4/30/2024 |