|
Download Data (XLS File) |
|
||||||||
|
||||||||
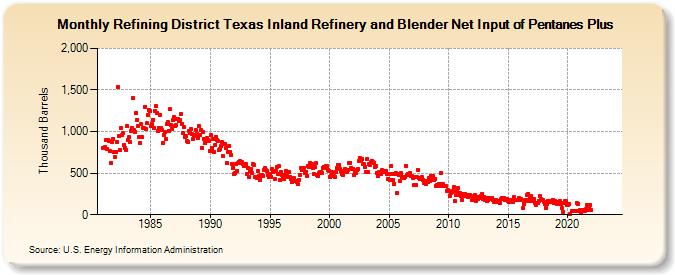
| Refining District Texas Inland Refinery and Blender Net Input of Pentanes Plus (Thousand Barrels) | ||||||||
| Year | Jan | Feb | Mar | Apr | May | Jun | Jul | Aug | Sep | Oct | Nov | Dec |
|---|---|---|---|---|---|---|---|---|---|---|---|---|
| 1981 | 808 | 799 | 814 | 894 | 788 | 897 | 881 | 763 | 619 | 873 | 916 | 754 |
| 1982 | 693 | 760 | 879 | 1,540 | 945 | 782 | 1,043 | 955 | 986 | 840 | 808 | 779 |
| 1983 | 1,065 | 900 | 930 | 873 | 1,009 | 1,045 | 1,398 | 1,019 | 998 | 1,227 | 1,138 | 1,071 |
| 1984 | 935 | 861 | 1,089 | 935 | 1,043 | 1,039 | 1,296 | 1,027 | 1,097 | 1,203 | 1,258 | 1,247 |
| 1985 | 1,063 | 1,085 | 1,144 | 1,047 | 1,245 | 1,303 | 1,226 | 1,007 | 1,043 | 1,200 | 1,042 | 1,013 |
| 1986 | 864 | 957 | 1,000 | 913 | 1,089 | 1,110 | 1,011 | 1,266 | 1,083 | 1,030 | 1,138 | 1,169 |
| 1987 | 1,065 | 1,074 | 1,147 | 1,151 | 1,129 | 1,136 | 1,210 | 1,096 | 984 | 1,050 | 940 | 942 |
| 1988 | 885 | 879 | 1,009 | 987 | 1,029 | 971 | 906 | 944 | 956 | 1,021 | 973 | 917 |
| 1989 | 1,066 | 955 | 1,013 | 806 | 989 | 914 | 858 | 906 | 918 | 902 | 881 | 764 |
| 1990 | 953 | 772 | 800 | 914 | 760 | 843 | 938 | 897 | 881 | 779 | 794 | 823 |
| 1991 | 873 | 706 | 853 | 850 | 797 | 621 | 755 | 829 | 755 | 714 | 614 | 564 |
| 1992 | 493 | 496 | 613 | 529 | 618 | 632 | 640 | 622 | 628 | 615 | 587 | 595 |
| 1993 | 606 | 488 | 564 | 453 | 523 | 548 | 503 | 606 | 603 | 450 | 457 | 439 |
| 1994 | 530 | 460 | 423 | 477 | 480 | 469 | 540 | 558 | 533 | 526 | 475 | 457 |
| 1995 | 485 | 457 | 550 | 511 | 525 | 424 | 528 | 576 | 486 | 580 | 413 | 517 |
| 1996 | 477 | 445 | 425 | 482 | 531 | 469 | 457 | 517 | 452 | 427 | 399 | 427 |
| 1997 | 438 | 403 | 405 | 399 | 365 | 420 | 483 | 564 | 534 | 545 | 559 | 505 |
| 1998 | 517 | 471 | 590 | 574 | 617 | 577 | 610 | 566 | 488 | 575 | 617 | 475 |
| 1999 | 461 | 498 | 512 | 518 | 497 | 562 | 578 | 558 | 591 | 585 | 542 | 531 |
| 2000 | 457 | 463 | 514 | 487 | 465 | 455 | 512 | 558 | 595 | 603 | 551 | 522 |
| 2001 | 492 | 474 | 524 | 520 | 554 | 532 | 512 | 536 | 623 | 625 | 563 | 547 |
| 2002 | 554 | 477 | 512 | 506 | 542 | 552 | 645 | 682 | 658 | 668 | 615 | 604 |
| 2003 | 574 | 512 | 675 | 509 | 613 | 602 | 631 | 646 | 628 | 624 | 571 | 583 |
| 2004 | 506 | 470 | 510 | 519 | 487 | 536 | 527 | 511 | 523 | 530 | 489 | 430 |
| 2005 | 494 | 421 | 586 | 493 | 415 | 373 | 493 | 504 | 260 | 494 | 473 | 401 |
| 2006 | 503 | 450 | 456 | 437 | 452 | 589 | 478 | 494 | 473 | 499 | 465 | 470 |
| 2007 | 441 | 352 | 450 | 355 | 453 | 542 | 438 | 427 | 438 | 449 | 413 | 384 |
| 2008 | 385 | 370 | 403 | 389 | 439 | 406 | 467 | 442 | 467 | 423 | 435 | 345 |
| 2009 | 359 | 344 | 364 | 369 | 504 | 341 | 369 | 350 | 351 | 348 | 289 | 302 |
| 2010 | 280 | 229 | 267 | 270 | 283 | 331 | 165 | 232 | 290 | 320 | 235 | 259 |
| 2011 | 229 | 175 | 247 | 222 | 248 | 226 | 235 | 212 | 231 | 234 | 225 | 172 |
| 2012 | 173 | 191 | 234 | 197 | 164 | 192 | 209 | 211 | 224 | 196 | 252 | 184 |
| 2013 | 215 | 181 | 201 | 160 | 179 | 200 | 202 | 194 | 201 | 181 | 151 | 179 |
| 2014 | 175 | 154 | 170 | 165 | 143 | 186 | 196 | 186 | 198 | 173 | 171 | 183 |
| 2015 | 166 | 154 | 176 | 180 | 169 | 158 | 219 | 174 | 177 | 182 | 173 | 201 |
| 2016 | 174 | 185 | 179 | 83 | 134 | 168 | 177 | 232 | 255 | 159 | 202 | 226 |
| 2017 | 179 | 161 | 187 | 136 | 120 | 137 | 144 | 168 | 225 | 188 | 177 | 171 |
| 2018 | 157 | 129 | 83 | 123 | 165 | 156 | 160 | 162 | 150 | 178 | 145 | 159 |
| 2019 | 151 | 133 | 148 | 157 | 160 | 128 | 76 | 32 | 146 | 163 | 162 | 122 |
| 2020 | 112 | 123 | 8 | 40 | 48 | 42 | 44 | 39 | 136 | 129 | 48 | |
| 2021 | 52 | 29 | 42 | 54 | 43 | 41 | 64 | 119 | 52 | 93 | 118 | 51 |
| 2022 | -- | -- | -- | -- | -- | -- | -- | -- | -- | -- | -- | -- |
| 2023 | -- | -- | -- | -- | -- | -- | -- | -- | -- | -- | -- | -- |
| 2024 | -- | |||||||||||
| - = No Data Reported; -- = Not Applicable; NA = Not Available; W = Withheld to avoid disclosure of individual company data. |
| Release Date: 3/29/2024 |
| Next Release Date: 4/30/2024 |