|
Download Data (XLS File) |
|
||||||||
|
||||||||
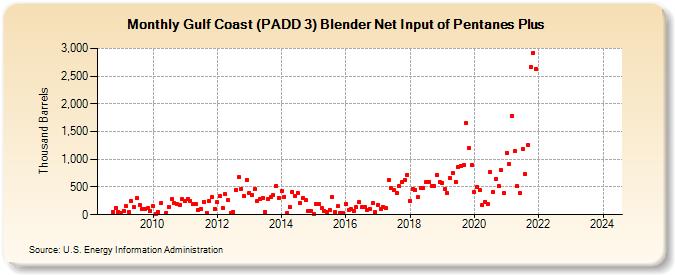
| Gulf Coast (PADD 3) Blender Net Input of Pentanes Plus (Thousand Barrels) | ||||||||
| Year | Jan | Feb | Mar | Apr | May | Jun | Jul | Aug | Sep | Oct | Nov | Dec |
|---|---|---|---|---|---|---|---|---|---|---|---|---|
| 2008 | 50 | 128 | 53 | |||||||||
| 2009 | 28 | 69 | 149 | 41 | 246 | 134 | 302 | 179 | 112 | 106 | 116 | 65 |
| 2010 | 160 | 21 | 55 | 211 | 34 | 140 | 278 | 208 | 186 | 178 | 275 | |
| 2011 | 242 | 290 | 249 | 185 | 186 | 82 | 111 | 238 | 39 | 251 | 314 | 102 |
| 2012 | 224 | 330 | 125 | 367 | 263 | 34 | 57 | 446 | 673 | 471 | 341 | 632 |
| 2013 | 391 | 362 | 462 | 255 | 290 | 301 | 49 | 276 | 313 | 355 | 521 | 305 |
| 2014 | 424 | 328 | 26 | 148 | 417 | 329 | 393 | 216 | 300 | 267 | 74 | 61 |
| 2015 | 20 | 192 | 191 | 120 | 75 | 46 | 94 | 321 | 45 | 152 | 26 | 39 |
| 2016 | 197 | 82 | 95 | 63 | 132 | 226 | 132 | 135 | 91 | 109 | 206 | 46 |
| 2017 | 177 | 108 | 145 | 115 | 634 | 476 | 442 | 389 | 513 | 583 | 629 | 723 |
| 2018 | 251 | 467 | 448 | 312 | 478 | 488 | 594 | 599 | 515 | 519 | 713 | 588 |
| 2019 | 579 | 465 | 386 | 658 | 754 | 598 | 867 | 882 | 894 | 1,657 | 1,195 | 898 |
| 2020 | 409 | 499 | 439 | 178 | 238 | 185 | 776 | 410 | 642 | 514 | 801 | 392 |
| 2021 | 1,118 | 918 | 1,788 | 1,142 | 516 | 388 | 1,187 | 727 | 1,261 | 2,661 | 2,922 | 2,630 |
| 2022 | -- | -- | -- | -- | -- | -- | -- | -- | -- | -- | -- | -- |
| 2023 | -- | -- | -- | -- | -- | -- | -- | -- | -- | -- | -- | -- |
| 2024 | -- | |||||||||||
| - = No Data Reported; -- = Not Applicable; NA = Not Available; W = Withheld to avoid disclosure of individual company data. |
| Release Date: 3/29/2024 |
| Next Release Date: 4/30/2024 |
Referring Pages: