|
Download Data (XLS File) |
|
||||||||
|
||||||||
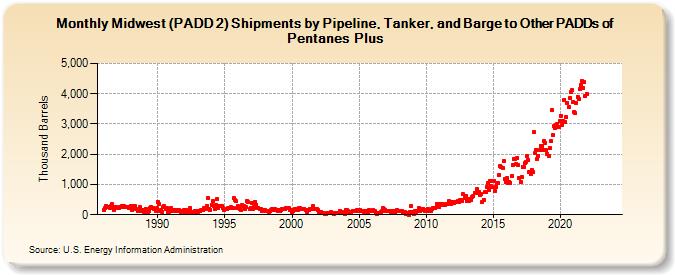
| Midwest (PADD 2) Shipments by Pipeline, Tanker, and Barge to Other PADDs of Pentanes Plus (Thousand Barrels) | ||||||||
| Year | Jan | Feb | Mar | Apr | May | Jun | Jul | Aug | Sep | Oct | Nov | Dec |
|---|---|---|---|---|---|---|---|---|---|---|---|---|
| 1986 | 144 | 221 | 300 | 256 | 258 | 231 | 274 | 344 | 257 | 166 | 251 | 255 |
| 1987 | 214 | 229 | 256 | 251 | 291 | 242 | 273 | 267 | 255 | 248 | 217 | 216 |
| 1988 | 291 | 158 | 272 | 224 | 277 | 202 | 138 | 108 | 243 | 156 | 135 | 168 |
| 1989 | 76 | 204 | 140 | 102 | 118 | 228 | 264 | 230 | 226 | 199 | 121 | 207 |
| 1990 | 435 | 359 | 111 | 149 | 104 | 239 | 278 | 173 | 212 | 92 | 101 | 127 |
| 1991 | 215 | 120 | 162 | 144 | 110 | 150 | 119 | 153 | 137 | 104 | 107 | 146 |
| 1992 | 84 | 156 | 97 | 93 | 136 | 218 | 91 | 95 | 83 | 125 | 137 | 88 |
| 1993 | 91 | 118 | 111 | 140 | 169 | 218 | 195 | 224 | 296 | 563 | 196 | 171 |
| 1994 | 323 | 439 | 293 | 176 | 326 | 522 | 229 | 292 | 283 | 301 | 223 | 168 |
| 1995 | 178 | 175 | 205 | 208 | 235 | 243 | 212 | 236 | 544 | 477 | 442 | 236 |
| 1996 | 278 | 186 | 167 | 305 | 293 | 281 | 205 | 242 | 455 | 420 | 183 | 236 |
| 1997 | 395 | 203 | 254 | 430 | 334 | 207 | 234 | 186 | 194 | 114 | 107 | 143 |
| 1998 | 159 | 117 | 109 | 106 | 119 | 153 | 175 | 180 | 164 | 180 | 165 | 123 |
| 1999 | 144 | 139 | 140 | 203 | 188 | 192 | 202 | 223 | 226 | 211 | 161 | 148 |
| 2000 | 106 | 118 | 144 | 176 | 189 | 152 | 221 | 206 | 200 | 190 | 175 | 189 |
| 2001 | 168 | 99 | 165 | 172 | 189 | 176 | 174 | 282 | 192 | 201 | 182 | 165 |
| 2002 | 86 | 89 | 90 | 72 | 63 | 30 | 25 | 41 | 63 | 63 | 60 | 74 |
| 2003 | 73 | 30 | 73 | 64 | 59 | 72 | 69 | 128 | 81 | 89 | 64 | 32 |
| 2004 | 154 | 148 | 111 | 95 | 97 | 104 | 133 | 113 | 118 | 118 | 148 | 128 |
| 2005 | 141 | 157 | 124 | 129 | 90 | 90 | 111 | 116 | 85 | 143 | 121 | 138 |
| 2006 | 157 | 138 | 113 | 71 | 40 | 51 | 47 | 76 | 109 | 211 | 179 | 170 |
| 2007 | 126 | 121 | 114 | 117 | 98 | 117 | 119 | 80 | 67 | 112 | 149 | 132 |
| 2008 | 128 | 129 | 113 | 48 | 61 | 75 | 22 | 53 | 2 | 87 | 279 | 76 |
| 2009 | 80 | 36 | 123 | 77 | 134 | 219 | 111 | 148 | 200 | 205 | 156 | 124 |
| 2010 | 166 | 203 | 107 | 131 | 132 | 191 | 229 | 222 | 224 | 360 | 260 | 245 |
| 2011 | 357 | 322 | 307 | 341 | 328 | 329 | 358 | 347 | 439 | 436 | 354 | 417 |
| 2012 | 406 | 390 | 404 | 415 | 449 | 422 | 480 | 501 | 457 | 670 | 565 | 621 |
| 2013 | 457 | 529 | 464 | 512 | 484 | 594 | 610 | 726 | 718 | 839 | 748 | 743 |
| 2014 | 651 | 677 | 415 | 490 | 740 | 758 | 902 | 1,041 | 828 | 1,124 | 945 | 906 |
| 2015 | 1,124 | 795 | 929 | 1,041 | 1,033 | 1,328 | 1,621 | 1,567 | 1,551 | 1,785 | 1,197 | 1,078 |
| 2016 | 1,219 | 1,034 | 1,092 | 1,062 | 1,277 | 1,646 | 1,851 | 1,851 | 1,666 | 1,884 | 1,646 | 1,202 |
| 2017 | 1,092 | 1,239 | 1,566 | 1,561 | 1,710 | 1,758 | 1,949 | 1,796 | 1,425 | 1,334 | 1,485 | 1,426 |
| 2018 | 2,723 | 2,041 | 2,153 | 1,832 | 1,949 | 2,138 | 2,272 | 2,281 | 2,149 | 2,422 | 2,381 | 2,138 |
| 2019 | 1,996 | 1,926 | 2,201 | 2,434 | 3,451 | 2,640 | 2,924 | 2,870 | 2,968 | 2,983 | 2,894 | 3,091 |
| 2020 | 3,275 | 2,951 | 3,113 | 3,804 | 3,065 | 3,224 | 3,699 | 3,553 | 3,853 | 4,046 | 4,110 | 3,728 |
| 2021 | 3,401 | 3,351 | 3,688 | 3,902 | 3,827 | 4,160 | 4,281 | 4,415 | 4,196 | 4,379 | 3,909 | 3,994 |
| 2022 | -- | -- | -- | -- | -- | -- | -- | -- | -- | -- | -- | -- |
| 2023 | -- | -- | -- | -- | -- | -- | -- | -- | -- | -- | -- | -- |
| 2024 | -- | |||||||||||
| - = No Data Reported; -- = Not Applicable; NA = Not Available; W = Withheld to avoid disclosure of individual company data. |
| Release Date: 3/29/2024 |
| Next Release Date: 4/30/2024 |