|
Download Data (XLS File) |
|
||||||||
|
||||||||
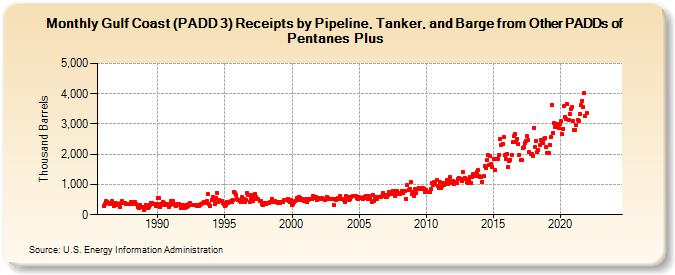
| Gulf Coast (PADD 3) Receipts by Pipeline, Tanker, and Barge from Other PADDs of Pentanes Plus (Thousand Barrels) | ||||||||
| Year | Jan | Feb | Mar | Apr | May | Jun | Jul | Aug | Sep | Oct | Nov | Dec |
|---|---|---|---|---|---|---|---|---|---|---|---|---|
| 1986 | 292 | 369 | 451 | 425 | 386 | 368 | 379 | 451 | 361 | 275 | 346 | 378 |
| 1987 | 329 | 342 | 256 | 377 | 456 | 377 | 385 | 389 | 358 | 365 | 353 | 357 |
| 1988 | 411 | 340 | 433 | 372 | 406 | 354 | 270 | 214 | 326 | 263 | 240 | 271 |
| 1989 | 172 | 315 | 273 | 209 | 259 | 331 | 403 | 378 | 346 | 347 | 278 | 362 |
| 1990 | 569 | 537 | 241 | 361 | 336 | 408 | 393 | 323 | 354 | 328 | 262 | 329 |
| 1991 | 467 | 341 | 460 | 305 | 286 | 346 | 362 | 342 | 323 | 220 | 334 | 292 |
| 1992 | 224 | 326 | 265 | 293 | 361 | 386 | 312 | 306 | 319 | 335 | 332 | 300 |
| 1993 | 309 | 287 | 314 | 352 | 376 | 417 | 378 | 410 | 438 | 684 | 349 | 286 |
| 1994 | 491 | 588 | 484 | 359 | 555 | 728 | 406 | 492 | 462 | 464 | 381 | 345 |
| 1995 | 302 | 317 | 422 | 387 | 410 | 441 | 408 | 498 | 755 | 733 | 660 | 505 |
| 1996 | 493 | 454 | 415 | 578 | 530 | 520 | 418 | 492 | 703 | 664 | 421 | 532 |
| 1997 | 648 | 444 | 529 | 681 | 599 | 520 | 505 | 437 | 458 | 361 | 316 | 403 |
| 1998 | 382 | 342 | 397 | 381 | 408 | 426 | 508 | 456 | 405 | 461 | 418 | 402 |
| 1999 | 432 | 373 | 413 | 430 | 427 | 481 | 477 | 477 | 504 | 445 | 406 | 470 |
| 2000 | 335 | 362 | 412 | 464 | 539 | 503 | 592 | 566 | 495 | 523 | 493 | 454 |
| 2001 | 504 | 408 | 478 | 508 | 517 | 509 | 513 | 630 | 543 | 573 | 500 | 527 |
| 2002 | 552 | 507 | 522 | 540 | 516 | 500 | 507 | 576 | 569 | 519 | 524 | 513 |
| 2003 | 534 | 323 | 534 | 475 | 508 | 543 | 512 | 615 | 518 | 526 | 470 | 422 |
| 2004 | 604 | 516 | 573 | 483 | 534 | 584 | 635 | 631 | 608 | 606 | 562 | 535 |
| 2005 | 576 | 538 | 555 | 516 | 575 | 539 | 622 | 581 | 507 | 622 | 532 | 419 |
| 2006 | 660 | 469 | 583 | 547 | 519 | 574 | 576 | 573 | 618 | 730 | 667 | 642 |
| 2007 | 583 | 570 | 649 | 736 | 695 | 738 | 786 | 698 | 623 | 777 | 788 | 693 |
| 2008 | 696 | 714 | 783 | 725 | 789 | 775 | 530 | 977 | 820 | 840 | 1,097 | 675 |
| 2009 | 756 | 614 | 862 | 717 | 862 | 895 | 874 | 855 | 865 | 882 | 865 | 766 |
| 2010 | 827 | 750 | 756 | 751 | 841 | 1,044 | 979 | 1,081 | 1,022 | 1,141 | 940 | 880 |
| 2011 | 1,071 | 882 | 937 | 1,050 | 982 | 1,028 | 1,142 | 1,031 | 1,102 | 1,231 | 1,059 | 1,046 |
| 2012 | 1,111 | 1,000 | 1,081 | 1,039 | 1,196 | 1,202 | 1,170 | 1,169 | 1,101 | 1,411 | 1,218 | 1,182 |
| 2013 | 1,094 | 1,062 | 1,162 | 1,241 | 1,049 | 1,239 | 1,343 | 1,335 | 1,275 | 1,428 | 1,475 | 1,289 |
| 2014 | 1,249 | 1,237 | 1,091 | 1,293 | 1,601 | 1,538 | 1,805 | 1,976 | 1,652 | 1,936 | 1,681 | 1,591 |
| 2015 | 1,843 | 1,468 | 1,842 | 1,828 | 1,853 | 1,959 | 2,498 | 2,313 | 2,347 | 2,575 | 1,962 | 1,849 |
| 2016 | 2,023 | 1,567 | 1,774 | 1,825 | 1,990 | 2,401 | 2,591 | 2,656 | 2,409 | 2,517 | 2,344 | 1,988 |
| 2017 | 1,804 | 1,797 | 2,210 | 2,223 | 2,372 | 2,429 | 2,598 | 2,458 | 2,075 | 1,999 | 2,017 | 1,954 |
| 2018 | 2,883 | 2,244 | 2,422 | 2,086 | 2,139 | 2,299 | 2,468 | 2,389 | 2,366 | 2,500 | 2,521 | 2,226 |
| 2019 | 2,053 | 2,026 | 2,319 | 2,557 | 3,639 | 2,697 | 3,025 | 2,903 | 2,977 | 2,987 | 2,869 | 3,006 |
| 2020 | 3,095 | 2,662 | 2,849 | 3,598 | 3,232 | 3,172 | 3,650 | 3,131 | 3,334 | 3,500 | 3,547 | 3,093 |
| 2021 | 2,801 | 2,805 | 2,957 | 3,142 | 3,114 | 3,340 | 3,618 | 3,769 | 3,573 | 4,032 | 3,268 | 3,367 |
| 2022 | -- | -- | -- | -- | -- | -- | -- | -- | -- | -- | -- | -- |
| 2023 | -- | -- | -- | -- | -- | -- | -- | -- | -- | -- | -- | -- |
| 2024 | -- | -- | -- | -- | -- | -- | ||||||
| - = No Data Reported; -- = Not Applicable; NA = Not Available; W = Withheld to avoid disclosure of individual company data. |
| Release Date: 8/30/2024 |
| Next Release Date: 9/30/2024 |