|
Download Data (XLS File) |
|
||||||||
|
||||||||
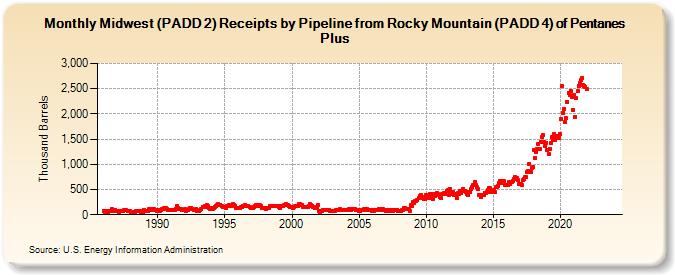
| Midwest (PADD 2) Receipts by Pipeline from Rocky Mountain (PADD 4) of Pentanes Plus (Thousand Barrels) | ||||||||
| Year | Jan | Feb | Mar | Apr | May | Jun | Jul | Aug | Sep | Oct | Nov | Dec |
|---|---|---|---|---|---|---|---|---|---|---|---|---|
| 1986 | 72 | 59 | 82 | 69 | 61 | 76 | 82 | 121 | 89 | 74 | 96 | 72 |
| 1987 | 74 | 59 | 71 | 68 | 77 | 70 | 84 | 91 | 86 | 77 | 75 | 75 |
| 1988 | 58 | 56 | 60 | 63 | 56 | 70 | 72 | 74 | 70 | 60 | 47 | 47 |
| 1989 | 84 | 68 | 79 | 80 | 105 | 105 | 98 | 99 | 111 | 104 | 97 | 82 |
| 1990 | 94 | 74 | 79 | 94 | 110 | 112 | 129 | 132 | 123 | 85 | 99 | 84 |
| 1991 | 85 | 88 | 94 | 98 | 123 | 174 | 131 | 113 | 116 | 115 | 86 | 91 |
| 1992 | 104 | 78 | 88 | 88 | 105 | 131 | 133 | 118 | 93 | 103 | 107 | 79 |
| 1993 | 77 | 78 | 97 | 114 | 155 | 156 | 167 | 162 | 191 | 177 | 133 | 107 |
| 1994 | 142 | 117 | 142 | 147 | 172 | 187 | 203 | 199 | 200 | 176 | 161 | 150 |
| 1995 | 146 | 136 | 166 | 167 | 183 | 164 | 192 | 203 | 188 | 179 | 142 | 131 |
| 1996 | 124 | 132 | 148 | 161 | 177 | 166 | 192 | 182 | 182 | 168 | 149 | 137 |
| 1997 | 137 | 131 | 155 | 173 | 188 | 185 | 177 | 184 | 166 | 140 | 131 | 137 |
| 1998 | 129 | 120 | 133 | 139 | 170 | 167 | 180 | 178 | 180 | 173 | 174 | 173 |
| 1999 | 161 | 142 | 169 | 164 | 173 | 187 | 186 | 214 | 192 | 177 | 150 | 150 |
| 2000 | 144 | 139 | 157 | 167 | 182 | 172 | 205 | 206 | 191 | 192 | 150 | 149 |
| 2001 | 161 | 153 | 159 | 179 | 211 | 187 | 180 | 162 | 133 | 130 | 147 | 185 |
| 2002 | 69 | 63 | 74 | 78 | 88 | 86 | 91 | 95 | 88 | 95 | 82 | 81 |
| 2003 | 77 | 67 | 74 | 86 | 87 | 90 | 103 | 110 | 99 | 98 | 92 | 96 |
| 2004 | 85 | 86 | 96 | 105 | 113 | 99 | 106 | 113 | 104 | 94 | 84 | 87 |
| 2005 | 81 | 73 | 85 | 101 | 107 | 100 | 113 | 116 | 98 | 92 | 85 | 82 |
| 2006 | 89 | 75 | 91 | 88 | 96 | 89 | 106 | 108 | 85 | 104 | 96 | 85 |
| 2007 | 77 | 74 | 88 | 82 | 99 | 82 | 82 | 100 | 101 | 95 | 91 | 77 |
| 2008 | 77 | 78 | 89 | 101 | 129 | 134 | 110 | 114 | 115 | 74 | 183 | 167 |
| 2009 | 256 | 229 | 272 | 268 | 298 | 334 | 374 | 393 | 360 | 334 | 302 | 318 |
| 2010 | 389 | 392 | 332 | 408 | 401 | 327 | 312 | 410 | 376 | 430 | 418 | 382 |
| 2011 | 361 | 325 | 403 | 402 | 433 | 413 | 467 | 488 | 393 | 517 | 450 | 407 |
| 2012 | 447 | 389 | 419 | 339 | 424 | 419 | 472 | 434 | 480 | 518 | 472 | 442 |
| 2013 | 407 | 383 | 448 | 456 | 509 | 551 | 588 | 648 | 582 | 551 | 504 | 388 |
| 2014 | 388 | 357 | 397 | 390 | 438 | 434 | 459 | 488 | 528 | 521 | 454 | 475 |
| 2015 | 491 | 450 | 547 | 557 | 579 | 622 | 675 | 624 | 672 | 669 | 598 | 596 |
| 2016 | 593 | 590 | 640 | 609 | 640 | 664 | 712 | 746 | 712 | 720 | 684 | 606 |
| 2017 | 601 | 597 | 682 | 700 | 740 | 749 | 855 | 864 | 1,015 | 850 | 919 | 942 |
| 2018 | 1,292 | 1,121 | 1,251 | 1,297 | 1,395 | 1,309 | 1,443 | 1,542 | 1,577 | 1,434 | 1,359 | 1,432 |
| 2019 | 1,288 | 1,197 | 1,295 | 1,413 | 1,534 | 1,478 | 1,607 | 1,485 | 1,544 | 1,556 | 1,520 | 1,607 |
| 2020 | 1,894 | 2,545 | 2,024 | 2,100 | 1,844 | 1,912 | 2,244 | 2,415 | 2,372 | 2,463 | 2,342 | 2,074 |
| 2021 | 2,380 | 1,948 | 2,311 | 2,453 | 2,560 | 2,616 | 2,665 | 2,713 | 2,573 | 2,560 | 2,528 | 2,501 |
| 2022 | -- | -- | -- | -- | -- | -- | -- | -- | -- | -- | -- | -- |
| 2023 | -- | -- | -- | -- | -- | -- | -- | -- | -- | -- | -- | -- |
| 2024 | -- | |||||||||||
| - = No Data Reported; -- = Not Applicable; NA = Not Available; W = Withheld to avoid disclosure of individual company data. |
| Release Date: 3/29/2024 |
| Next Release Date: 4/30/2024 |