|
Download Data (XLS File) |
|
||||||||
|
||||||||
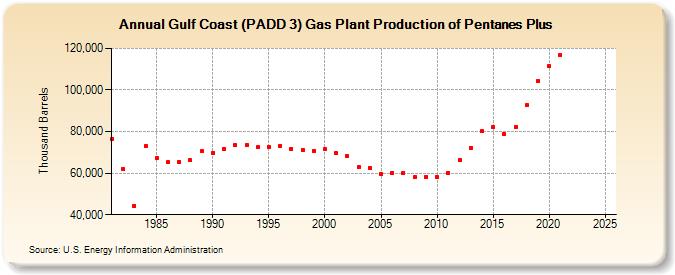
| Gulf Coast (PADD 3) Gas Plant Production of Pentanes Plus (Thousand Barrels) | ||||||||
| Decade | Year-0 | Year-1 | Year-2 | Year-3 | Year-4 | Year-5 | Year-6 | Year-7 | Year-8 | Year-9 |
|---|---|---|---|---|---|---|---|---|---|---|
| 1980's | 76,653 | 62,062 | 44,431 | 73,033 | 67,126 | 65,311 | 65,385 | 66,178 | 70,454 | |
| 1990's | 69,765 | 71,743 | 73,380 | 73,415 | 72,540 | 72,450 | 73,258 | 71,732 | 71,258 | 70,755 |
| 2000's | 71,512 | 69,480 | 68,094 | 62,871 | 62,620 | 59,660 | 60,090 | 60,280 | 57,974 | 58,162 |
| 2010's | 58,105 | 60,268 | 66,222 | 72,279 | 80,174 | 82,188 | 78,653 | 82,221 | 92,602 | 104,399 |
| 2020's | 111,300 | 116,725 | -- | -- |
| - = No Data Reported; -- = Not Applicable; NA = Not Available; W = Withheld to avoid disclosure of individual company data. |
| Release Date: 8/30/2024 |
| Next Release Date: 8/29/2025 |