|
Download Data (XLS File) |
|
||||||||
|
||||||||
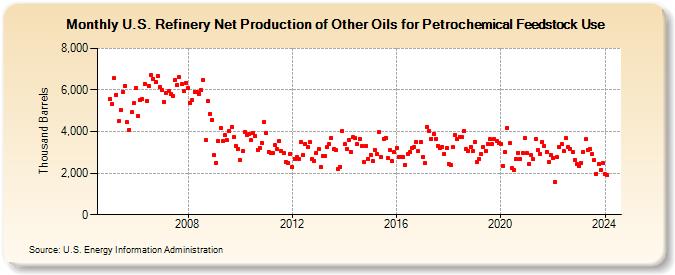
| U.S. Refinery Net Production of Other Oils for Petrochemical Feedstock Use (Thousand Barrels) | ||||||||
| Year | Jan | Feb | Mar | Apr | May | Jun | Jul | Aug | Sep | Oct | Nov | Dec |
|---|---|---|---|---|---|---|---|---|---|---|---|---|
| 2005 | 5,555 | 5,314 | 6,562 | 5,773 | 4,493 | 5,038 | 5,923 | 6,188 | 4,445 | 4,088 | 4,927 | 5,356 |
| 2006 | 6,095 | 4,751 | 5,505 | 5,542 | 6,289 | 5,493 | 6,205 | 6,702 | 6,543 | 6,370 | 6,693 | 6,123 |
| 2007 | 5,986 | 5,436 | 5,876 | 5,947 | 5,796 | 5,718 | 6,483 | 6,224 | 6,611 | 6,271 | 5,935 | 6,346 |
| 2008 | 6,072 | 5,358 | 5,497 | 5,926 | 5,890 | 5,822 | 5,986 | 6,471 | 3,575 | 5,461 | 4,867 | 4,577 |
| 2009 | 2,861 | 2,495 | 3,535 | 4,178 | 3,559 | 3,855 | 3,587 | 4,016 | 4,213 | 3,729 | 3,307 | 3,150 |
| 2010 | 2,630 | 3,052 | 4,002 | 3,833 | 3,890 | 3,582 | 3,941 | 3,782 | 3,126 | 3,199 | 3,464 | 4,476 |
| 2011 | 3,937 | 3,034 | 2,966 | 2,992 | 3,337 | 3,137 | 3,530 | 3,048 | 2,951 | 2,557 | 2,483 | 2,944 |
| 2012 | 2,273 | 2,702 | 2,773 | 2,691 | 3,501 | 2,891 | 3,414 | 3,275 | 3,506 | 2,664 | 2,600 | 2,975 |
| 2013 | 3,159 | 2,296 | 2,801 | 2,840 | 3,242 | 3,397 | 3,690 | 3,157 | 3,093 | 2,219 | 2,318 | 4,008 |
| 2014 | 3,385 | 3,152 | 3,610 | 3,019 | 3,724 | 3,683 | 3,393 | 3,653 | 3,318 | 2,526 | 3,312 | 2,673 |
| 2015 | 2,875 | 2,576 | 3,118 | 2,903 | 3,972 | 2,767 | 3,652 | 3,702 | 2,751 | 3,089 | 2,565 | 2,994 |
| 2016 | 3,190 | 2,800 | 2,797 | 2,765 | 2,407 | 2,911 | 2,994 | 3,199 | 3,256 | 3,514 | 3,050 | 3,516 |
| 2017 | 2,760 | 2,469 | 4,231 | 4,041 | 3,658 | 3,896 | 3,645 | 3,317 | 3,200 | 3,260 | 2,933 | 3,210 |
| 2018 | 2,455 | 2,389 | 3,242 | 3,833 | 3,639 | 3,751 | 3,737 | 4,033 | 3,139 | 3,087 | 3,252 | 3,053 |
| 2019 | 3,518 | 2,553 | 2,685 | 2,920 | 3,274 | 3,069 | 3,387 | 3,638 | 3,424 | 3,619 | 3,565 | 3,469 |
| 2020 | 3,419 | 2,345 | 3,017 | 4,185 | 3,427 | 2,242 | 2,162 | 2,690 | 2,985 | 2,690 | 2,992 | 3,703 |
| 2021 | 2,959 | 2,433 | 2,849 | 2,664 | 3,641 | 3,094 | 2,932 | 3,510 | 3,303 | 3,040 | 2,525 | 2,865 |
| 2022 | 2,731 | 1,570 | 2,752 | 3,253 | 3,390 | 3,062 | 3,681 | 3,239 | 3,175 | 3,006 | 2,651 | 2,433 |
| 2023 | 2,358 | 2,494 | 3,024 | 3,619 | 3,136 | 3,150 | 2,921 | 2,619 | 1,981 | 2,427 | 2,138 | 2,487 |
| 2024 | 1,955 | |||||||||||
| - = No Data Reported; -- = Not Applicable; NA = Not Available; W = Withheld to avoid disclosure of individual company data. |
| Release Date: 3/29/2024 |
| Next Release Date: 4/30/2024 |