|
Download Data (XLS File) |
|
||||||||
|
||||||||
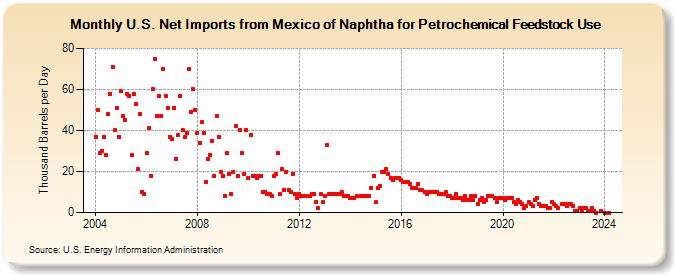
| U.S. Net Imports from Mexico of Naphtha for Petrochemical Feedstock Use (Thousand Barrels per Day) | ||||||||
| Year | Jan | Feb | Mar | Apr | May | Jun | Jul | Aug | Sep | Oct | Nov | Dec |
|---|---|---|---|---|---|---|---|---|---|---|---|---|
| 2004 | 37 | 50 | 29 | 30 | 37 | 28 | 48 | 58 | 71 | 40 | 51 | 37 |
| 2005 | 59 | 47 | 45 | 58 | 57 | 28 | 58 | 53 | 21 | 48 | 10 | 9 |
| 2006 | 29 | 41 | 18 | 60 | 75 | 47 | 57 | 47 | 70 | 57 | 51 | 37 |
| 2007 | 36 | 51 | 26 | 38 | 57 | 40 | 37 | 39 | 70 | 49 | 60 | 50 |
| 2008 | 39 | 34 | 44 | 39 | 15 | 26 | 28 | 35 | 18 | 47 | 37 | 20 |
| 2009 | 18 | 8 | 29 | 19 | 9 | 20 | 42 | 18 | 40 | 29 | 19 | 40 |
| 2010 | 17 | 38 | 18 | 18 | 17 | 18 | 18 | 10 | 10 | 9 | 9 | 8 |
| 2011 | 18 | 19 | 29 | 9 | 21 | 11 | 20 | 11 | 10 | 19 | 9 | 7 |
| 2012 | 9 | 8 | 8 | 8 | 8 | 8 | 9 | 9 | 5 | 2 | 9 | 5 |
| 2013 | 8 | 33 | 9 | 9 | 9 | 9 | 9 | 9 | 10 | 8 | 8 | 8 |
| 2014 | 7 | 7 | 7 | 8 | 8 | 8 | 8 | 8 | 8 | 12 | 18 | |
| 2015 | 5 | 12 | 13 | 20 | 20 | 21 | 19 | 17 | 16 | 17 | 17 | 17 |
| 2016 | 16 | 15 | 15 | 15 | 14 | 12 | 12 | 12 | 14 | 11 | 11 | 10 |
| 2017 | 9 | 10 | 10 | 10 | 10 | 10 | 9 | 9 | 9 | 10 | 8 | 8 |
| 2018 | 7 | 7 | 9 | 7 | 7 | 6 | 8 | 6 | 6 | 8 | 6 | 8 |
| 2019 | 4 | 6 | 7 | 5 | 6 | 8 | 8 | 8 | 7 | 5 | 7 | 7 |
| 2020 | 7 | 6 | 7 | 7 | 7 | 5 | 4 | 6 | 5 | 4 | 2 | 3 |
| 2021 | 5 | 4 | 3 | 6 | 7 | 4 | 3 | 3 | 3 | 2 | 2 | 5 |
| 2022 | 4 | 3 | 2 | 4 | 4 | 3 | 4 | 4 | 3 | 1 | 1 | |
| 2023 | 2 | 1 | 2 | 2 | 1 | 1 | 2 | 1 | 0 | 1 | ||
| 2024 | 0 | 0 | ||||||||||
| - = No Data Reported; -- = Not Applicable; NA = Not Available; W = Withheld to avoid disclosure of individual company data. |
| Release Date: 8/30/2024 |
| Next Release Date: 9/30/2024 |