|
Download Data (XLS File) |
|
||||||||
|
||||||||
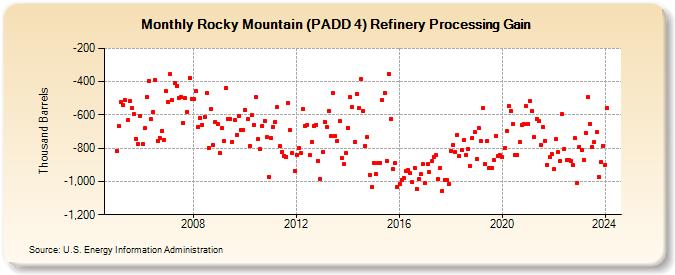
| Rocky Mountain (PADD 4) Refinery Processing Gain (Thousand Barrels) | ||||||||
| Year | Jan | Feb | Mar | Apr | May | Jun | Jul | Aug | Sep | Oct | Nov | Dec |
|---|---|---|---|---|---|---|---|---|---|---|---|---|
| 2005 | -818 | -667 | -522 | -543 | -512 | -631 | -519 | -560 | -595 | -743 | -774 | -605 |
| 2006 | -775 | -681 | -494 | -396 | -627 | -582 | -391 | -755 | -740 | -695 | -749 | -458 |
| 2007 | -521 | -356 | -511 | -409 | -426 | -496 | -492 | -648 | -499 | -581 | -376 | -504 |
| 2008 | -505 | -458 | -670 | -617 | -659 | -610 | -471 | -799 | -565 | -780 | -643 | -656 |
| 2009 | -827 | -680 | -759 | -438 | -624 | -624 | -761 | -631 | -718 | -604 | -688 | -690 |
| 2010 | -570 | -625 | -789 | -602 | -659 | -494 | -747 | -806 | -664 | -637 | -733 | -971 |
| 2011 | -739 | -674 | -641 | -555 | -789 | -822 | -845 | -850 | -531 | -691 | -828 | -936 |
| 2012 | -842 | -799 | -829 | -565 | -665 | -658 | -843 | -761 | -667 | -658 | -875 | -986 |
| 2013 | -824 | -642 | -670 | -576 | -729 | -471 | -726 | -758 | -639 | -858 | -898 | -829 |
| 2014 | -677 | -494 | -554 | -764 | -474 | -557 | -386 | -578 | -788 | -733 | -961 | -1,034 |
| 2015 | -887 | -956 | -891 | -887 | -511 | -467 | -877 | -355 | -627 | -926 | -888 | -1,031 |
| 2016 | -1,018 | -989 | -979 | -935 | -933 | -951 | -1,006 | -918 | -1,043 | -985 | -957 | -897 |
| 2017 | -1,012 | -896 | -946 | -878 | -853 | -843 | -986 | -917 | -1,058 | -989 | -991 | -1,018 |
| 2018 | -816 | -780 | -820 | -719 | -848 | -808 | -752 | -842 | -804 | -905 | -736 | -705 |
| 2019 | -868 | -681 | -756 | -557 | -898 | -758 | -918 | -922 | -873 | -728 | -847 | -843 |
| 2020 | -855 | -796 | -696 | -547 | -575 | -657 | -842 | -840 | -765 | -661 | -655 | -546 |
| 2021 | -656 | -518 | -577 | -732 | -627 | -634 | -778 | -675 | -756 | -899 | -855 | -836 |
| 2022 | -928 | -745 | -824 | -878 | -596 | -804 | -873 | -870 | -879 | -901 | -741 | -1,007 |
| 2023 | -790 | -812 | -870 | -710 | -493 | -652 | -792 | -765 | -704 | -972 | -884 | -788 |
| 2024 | -899 | |||||||||||
| - = No Data Reported; -- = Not Applicable; NA = Not Available; W = Withheld to avoid disclosure of individual company data. |
| Release Date: 3/29/2024 |
| Next Release Date: 4/30/2024 |