|
Download Data (XLS File) |
|
||||||||
|
||||||||
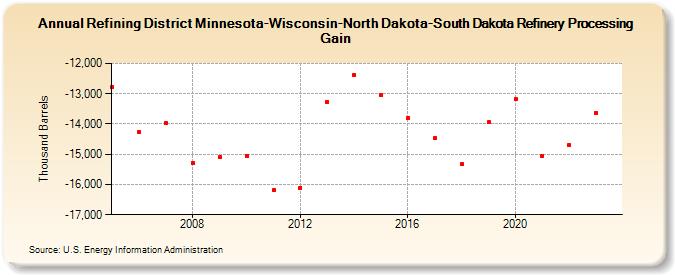
| Refining District Minnesota-Wisconsin-North Dakota-South Dakota Refinery Processing Gain (Thousand Barrels) | ||||||||
| Decade | Year-0 | Year-1 | Year-2 | Year-3 | Year-4 | Year-5 | Year-6 | Year-7 | Year-8 | Year-9 |
|---|---|---|---|---|---|---|---|---|---|---|
| 2000's | -12,790 | -14,277 | -13,964 | -15,287 | -15,089 | |||||
| 2010's | -15,050 | -16,191 | -16,101 | -13,264 | -12,380 | -13,038 | -13,796 | -14,477 | -15,337 | -13,951 |
| 2020's | -13,189 | -15,048 | -14,702 | -13,626 |
| - = No Data Reported; -- = Not Applicable; NA = Not Available; W = Withheld to avoid disclosure of individual company data. |
| Release Date: 3/29/2024 |
| Next Release Date: 8/30/2024 |