|
Download Data (XLS File) |
|
||||||||
|
||||||||
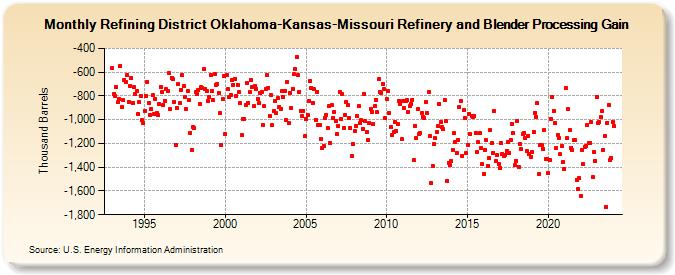
| Refining District Oklahoma-Kansas-Missouri Refinery and Blender Processing Gain (Thousand Barrels) | ||||||||
| Year | Jan | Feb | Mar | Apr | May | Jun | Jul | Aug | Sep | Oct | Nov | Dec |
|---|---|---|---|---|---|---|---|---|---|---|---|---|
| 1993 | -564 | -786 | -799 | -724 | -852 | -823 | -546 | -894 | -838 | -662 | -682 | -625 |
| 1994 | -848 | -716 | -646 | -859 | -726 | -788 | -762 | -953 | -853 | -800 | -1,004 | -1,029 |
| 1995 | -923 | -802 | -684 | -858 | -958 | -912 | -795 | -949 | -828 | -943 | -964 | -868 |
| 1996 | -721 | -771 | -878 | -842 | -745 | -758 | -609 | -911 | -648 | -661 | -851 | -1,210 |
| 1997 | -902 | -700 | -862 | -747 | -624 | -719 | -812 | -912 | -759 | -837 | -1,112 | -1,255 |
| 1998 | -1,061 | -1,069 | -768 | -788 | -753 | -868 | -728 | -733 | -573 | -743 | -757 | -841 |
| 1999 | -810 | -624 | -760 | -838 | -618 | -706 | -703 | -776 | -948 | -1,213 | -829 | -632 |
| 2000 | -1,121 | -623 | -746 | -812 | -792 | -665 | -705 | -655 | -801 | -710 | -769 | -863 |
| 2001 | -1,132 | -998 | -991 | -876 | -688 | -856 | -769 | -667 | -721 | -889 | -715 | -740 |
| 2002 | -830 | -860 | -774 | -765 | -1,045 | -888 | -743 | -624 | -735 | -967 | -795 | -1,047 |
| 2003 | -928 | -846 | -947 | -821 | -892 | -909 | -762 | -809 | -755 | -1,000 | -679 | -1,027 |
| 2004 | -772 | -899 | -739 | -617 | -574 | -471 | -624 | -763 | -924 | -970 | -929 | -1,141 |
| 2005 | -992 | -959 | -843 | -671 | -733 | -858 | -744 | -999 | -765 | -1,044 | -1,043 | -1,160 |
| 2006 | -1,237 | -1,223 | -983 | -960 | -1,071 | -888 | -1,195 | -879 | -983 | -935 | -1,007 | -1,122 |
| 2007 | -1,054 | -767 | -994 | -782 | -1,067 | -960 | -854 | -877 | -987 | -1,072 | -1,304 | -1,208 |
| 2008 | -1,094 | -1,050 | -968 | -889 | -1,024 | -1,006 | -1,076 | -783 | -1,014 | -1,104 | -1,172 | -1,029 |
| 2009 | -909 | -938 | -1,035 | -887 | -832 | -938 | -660 | -768 | -775 | -699 | -743 | -989 |
| 2010 | -829 | -756 | -943 | -1,062 | -1,133 | -1,102 | -1,022 | -1,095 | -1,040 | -839 | -872 | -1,165 |
| 2011 | -847 | -900 | -846 | -834 | -933 | -888 | -866 | -832 | -1,343 | -1,050 | -1,153 | -913 |
| 2012 | -1,119 | -1,116 | -940 | -977 | -989 | -851 | -943 | -769 | -1,139 | -1,532 | -1,389 | -1,201 |
| 2013 | -1,158 | -1,105 | -1,056 | -864 | -1,020 | -1,058 | -1,081 | -834 | -1,014 | -1,515 | -1,367 | -1,384 |
| 2014 | -1,346 | -1,252 | -1,116 | -1,191 | -1,277 | -1,173 | -892 | -845 | -1,302 | -922 | -984 | -1,281 |
| 2015 | -1,210 | -951 | -1,124 | -967 | -977 | -967 | -1,108 | -1,274 | -1,186 | -1,116 | -1,237 | -1,369 |
| 2016 | -1,456 | -1,259 | -1,172 | -1,386 | -1,322 | -1,091 | -1,199 | -1,277 | -929 | -1,348 | -1,299 | -1,373 |
| 2017 | -1,407 | -1,200 | -1,291 | -1,302 | -1,294 | -1,262 | -1,189 | -1,282 | -1,173 | -1,033 | -1,116 | -1,385 |
| 2018 | -1,345 | -1,011 | -1,400 | -1,203 | -1,250 | -1,123 | -1,112 | -1,155 | -1,265 | -1,135 | -1,289 | -1,316 |
| 2019 | -1,268 | -1,102 | -941 | -975 | -861 | -1,461 | -1,213 | -1,212 | -1,243 | -1,086 | -1,331 | -1,330 |
| 2020 | -1,448 | -1,340 | -996 | -812 | -925 | -1,024 | -1,241 | -1,131 | -1,156 | -1,293 | -1,218 | -1,355 |
| 2021 | -1,412 | -731 | -1,155 | -912 | -1,086 | -1,236 | -1,254 | -1,167 | -1,172 | -1,504 | -1,587 | -1,493 |
| 2022 | -1,640 | -1,252 | -1,373 | -1,227 | -1,221 | -1,047 | -1,200 | -1,194 | -1,022 | -1,484 | -1,270 | -1,346 |
| 2023 | -807 | -1,025 | -1,019 | -975 | -927 | -1,256 | -1,137 | -1,732 | -1,028 | -876 | -1,338 | -1,319 |
| 2024 | -1,018 | |||||||||||
| - = No Data Reported; -- = Not Applicable; NA = Not Available; W = Withheld to avoid disclosure of individual company data. |
| Release Date: 3/29/2024 |
| Next Release Date: 4/30/2024 |