|
Download Data (XLS File) |
|
||||||||
|
||||||||
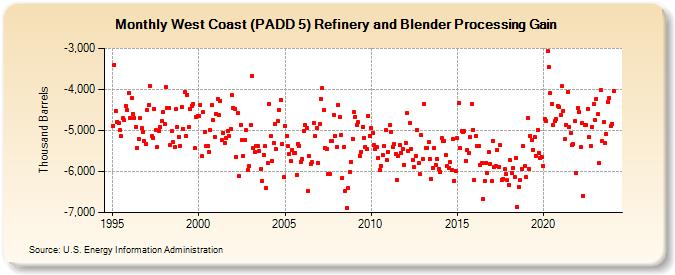
| West Coast (PADD 5) Refinery and Blender Processing Gain (Thousand Barrels) | ||||||||
| Year | Jan | Feb | Mar | Apr | May | Jun | Jul | Aug | Sep | Oct | Nov | Dec |
|---|---|---|---|---|---|---|---|---|---|---|---|---|
| 1995 | -4,881 | -3,400 | -4,514 | -4,785 | -4,823 | -4,986 | -5,141 | -4,703 | -4,756 | -4,394 | -4,503 | -4,084 |
| 1996 | -4,702 | -4,213 | -4,592 | -4,694 | -4,917 | -5,432 | -5,202 | -4,703 | -4,947 | -5,029 | -5,265 | -5,332 |
| 1997 | -4,493 | -4,374 | -3,916 | -5,142 | -5,186 | -4,470 | -4,992 | -5,404 | -5,003 | -4,921 | -4,765 | -4,555 |
| 1998 | -4,852 | -3,943 | -4,453 | -4,458 | -5,351 | -5,024 | -5,289 | -5,410 | -4,477 | -4,915 | -5,149 | -5,377 |
| 1999 | -4,428 | -4,953 | -4,071 | -5,137 | -4,125 | -4,905 | -4,486 | -4,403 | -4,352 | -5,431 | -4,667 | -4,641 |
| 2000 | -4,645 | -4,373 | -5,633 | -4,561 | -5,042 | -5,368 | -5,385 | -5,524 | -5,000 | -4,380 | -4,755 | -5,149 |
| 2001 | -4,591 | -4,231 | -4,620 | -4,277 | -5,238 | -5,072 | -5,311 | -5,189 | -5,014 | -5,126 | -4,961 | -4,143 |
| 2002 | -4,448 | -4,473 | -5,644 | -4,584 | -6,119 | -4,860 | -5,232 | -5,628 | -5,241 | -4,998 | -5,953 | -5,873 |
| 2003 | -4,875 | -3,679 | -5,439 | -5,523 | -5,381 | -5,390 | -5,503 | -5,937 | -6,231 | -5,590 | -5,388 | -6,393 |
| 2004 | -5,799 | -4,346 | -5,143 | -5,741 | -5,299 | -4,834 | -5,460 | -4,777 | -4,500 | -4,251 | -5,335 | -6,142 |
| 2005 | -4,885 | -5,131 | -5,388 | -5,571 | -5,747 | -5,481 | -5,540 | -5,541 | -6,078 | -5,322 | -5,369 | -5,768 |
| 2006 | -5,686 | -5,014 | -4,869 | -4,944 | -6,477 | -5,620 | -5,816 | -5,775 | -4,810 | -5,143 | -4,945 | -5,786 |
| 2007 | -4,848 | -4,239 | -3,977 | -4,498 | -5,419 | -5,447 | -6,065 | -6,071 | -5,266 | -5,260 | -4,613 | -5,125 |
| 2008 | -5,396 | -4,372 | -4,672 | -5,108 | -6,147 | -5,393 | -6,472 | -6,880 | -6,407 | -6,006 | -5,762 | -5,200 |
| 2009 | -4,550 | -4,665 | -4,871 | -4,800 | -5,612 | -5,528 | -4,908 | -5,176 | -5,397 | -5,463 | -4,637 | -5,130 |
| 2010 | -4,942 | -5,061 | -5,348 | -5,457 | -5,410 | -5,663 | -5,975 | -5,858 | -5,601 | -5,383 | -4,995 | -5,723 |
| 2011 | -5,523 | -4,867 | -5,026 | -5,391 | -5,336 | -5,565 | -6,199 | -5,610 | -5,366 | -5,538 | -5,449 | -5,833 |
| 2012 | -5,299 | -4,584 | -5,494 | -4,814 | -5,458 | -5,708 | -5,897 | -5,624 | -4,978 | -5,800 | -6,069 | -5,109 |
| 2013 | -5,686 | -4,346 | -5,422 | -5,425 | -5,290 | -5,690 | -6,189 | -5,907 | -5,423 | -5,841 | -5,689 | -5,944 |
| 2014 | -6,011 | -5,195 | -5,262 | -5,257 | -5,601 | -5,874 | -5,909 | -5,769 | -5,951 | -5,213 | -6,226 | -5,981 |
| 2015 | -5,195 | -4,331 | -5,427 | -5,013 | -5,041 | -5,024 | -5,736 | -5,476 | -5,547 | -5,153 | -4,347 | -4,980 |
| 2016 | -6,207 | -5,123 | -5,371 | -5,384 | -5,852 | -5,798 | -6,663 | -6,226 | -5,785 | -6,048 | -5,532 | -5,811 |
| 2017 | -6,235 | -5,246 | -5,896 | -5,875 | -5,475 | -5,887 | -5,348 | -6,196 | -6,173 | -5,947 | -6,061 | -6,210 |
| 2018 | -6,325 | -5,729 | -6,028 | -5,913 | -6,131 | -5,662 | -6,861 | -6,384 | -6,210 | -5,944 | -5,388 | -5,871 |
| 2019 | -6,145 | -4,706 | -5,930 | -5,137 | -5,221 | -5,466 | -5,155 | -5,614 | -4,987 | -5,539 | -5,663 | -5,638 |
| 2020 | -5,866 | -4,726 | -4,777 | -3,071 | -3,450 | -4,092 | -4,347 | -4,878 | -4,763 | -4,731 | -4,393 | -4,427 |
| 2021 | -4,621 | -3,926 | -4,514 | -5,219 | -4,860 | -4,054 | -4,918 | -5,065 | -5,357 | -5,340 | -4,776 | -6,040 |
| 2022 | -4,454 | -4,559 | -5,404 | -4,817 | -6,595 | -4,863 | -4,868 | -4,467 | -5,168 | -5,378 | -4,926 | -4,349 |
| 2023 | -4,741 | -4,226 | -4,608 | -5,803 | -4,025 | -5,251 | -4,782 | -5,302 | -5,081 | -4,305 | -4,204 | -4,899 |
| 2024 | -4,835 | |||||||||||
| - = No Data Reported; -- = Not Applicable; NA = Not Available; W = Withheld to avoid disclosure of individual company data. |
| Release Date: 3/29/2024 |
| Next Release Date: 4/30/2024 |