|
Download Data (XLS File) |
|
||||||||
|
||||||||
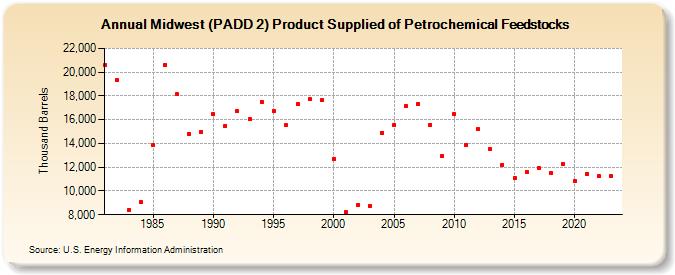
| Midwest (PADD 2) Product Supplied of Petrochemical Feedstocks (Thousand Barrels) | ||||||||
| Decade | Year-0 | Year-1 | Year-2 | Year-3 | Year-4 | Year-5 | Year-6 | Year-7 | Year-8 | Year-9 |
|---|---|---|---|---|---|---|---|---|---|---|
| 1980's | 20,611 | 19,302 | 8,397 | 9,040 | 13,865 | 20,632 | 18,135 | 14,831 | 14,979 | |
| 1990's | 16,445 | 15,493 | 16,693 | 16,023 | 17,524 | 16,739 | 15,520 | 17,338 | 17,713 | 17,653 |
| 2000's | 12,695 | 8,211 | 8,833 | 8,756 | 14,920 | 15,590 | 17,134 | 17,354 | 15,559 | 12,928 |
| 2010's | 16,470 | 13,897 | 15,215 | 13,524 | 12,224 | 11,102 | 11,590 | 11,931 | 11,503 | 12,249 |
| 2020's | 10,800 | 11,421 | 11,231 | 11,251 |
| - = No Data Reported; -- = Not Applicable; NA = Not Available; W = Withheld to avoid disclosure of individual company data. |
| Release Date: 3/29/2024 |
| Next Release Date: 8/30/2024 |