|
Download Data (XLS File) |
|
||||||||
|
||||||||
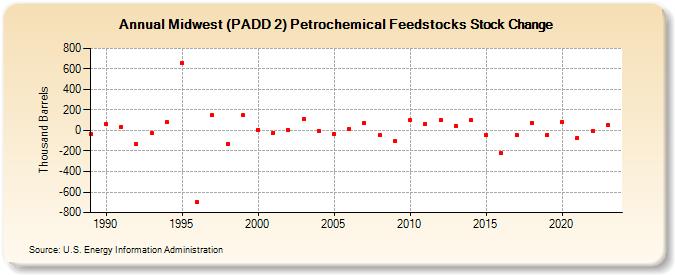
| Midwest (PADD 2) Petrochemical Feedstocks Stock Change (Thousand Barrels) | ||||||||
| Decade | Year-0 | Year-1 | Year-2 | Year-3 | Year-4 | Year-5 | Year-6 | Year-7 | Year-8 | Year-9 |
|---|---|---|---|---|---|---|---|---|---|---|
| 1980's | -34 | |||||||||
| 1990's | 59 | 38 | -135 | -25 | 80 | 657 | -700 | 150 | -129 | 147 |
| 2000's | 8 | -20 | 3 | 110 | -2 | -34 | 14 | 73 | -44 | -105 |
| 2010's | 103 | 63 | 103 | 45 | 102 | -45 | -222 | -45 | 77 | -45 |
| 2020's | 84 | -72 | -4 | 49 |
| - = No Data Reported; -- = Not Applicable; NA = Not Available; W = Withheld to avoid disclosure of individual company data. |
| Release Date: 3/29/2024 |
| Next Release Date: 8/30/2024 |